

Turn Building Performance Data Into a Clear Project Story

Building performance data becomes a useful project story when it answers one decision. A dashboard with dozens of readings may be accurate but still fail to explain what changed, under which conditions and why the result matters.
Start with the project boundary and measurement question. Choose only the data needed to support it.
How should building performance data be presented in a case study?
State the building and system boundary, baseline, intervention, reporting period, data source, relevant operating conditions, calculation or adjustment method, measured result and limitations.
| Story step | Evidence | Reader question |
|---|---|---|
| Context | Building type, use, area and problem | What was happening? |
| Baseline | Period, meter, conditions and value | What was the starting point? |
| Intervention | Scope, date and commissioning | What changed? |
| Measurement | Sensors, interval and data quality | How was it observed? |
| Result | Value, unit and comparison | What happened? |
| Limits | Weather, use, missing data and scope | How far can we apply it? |
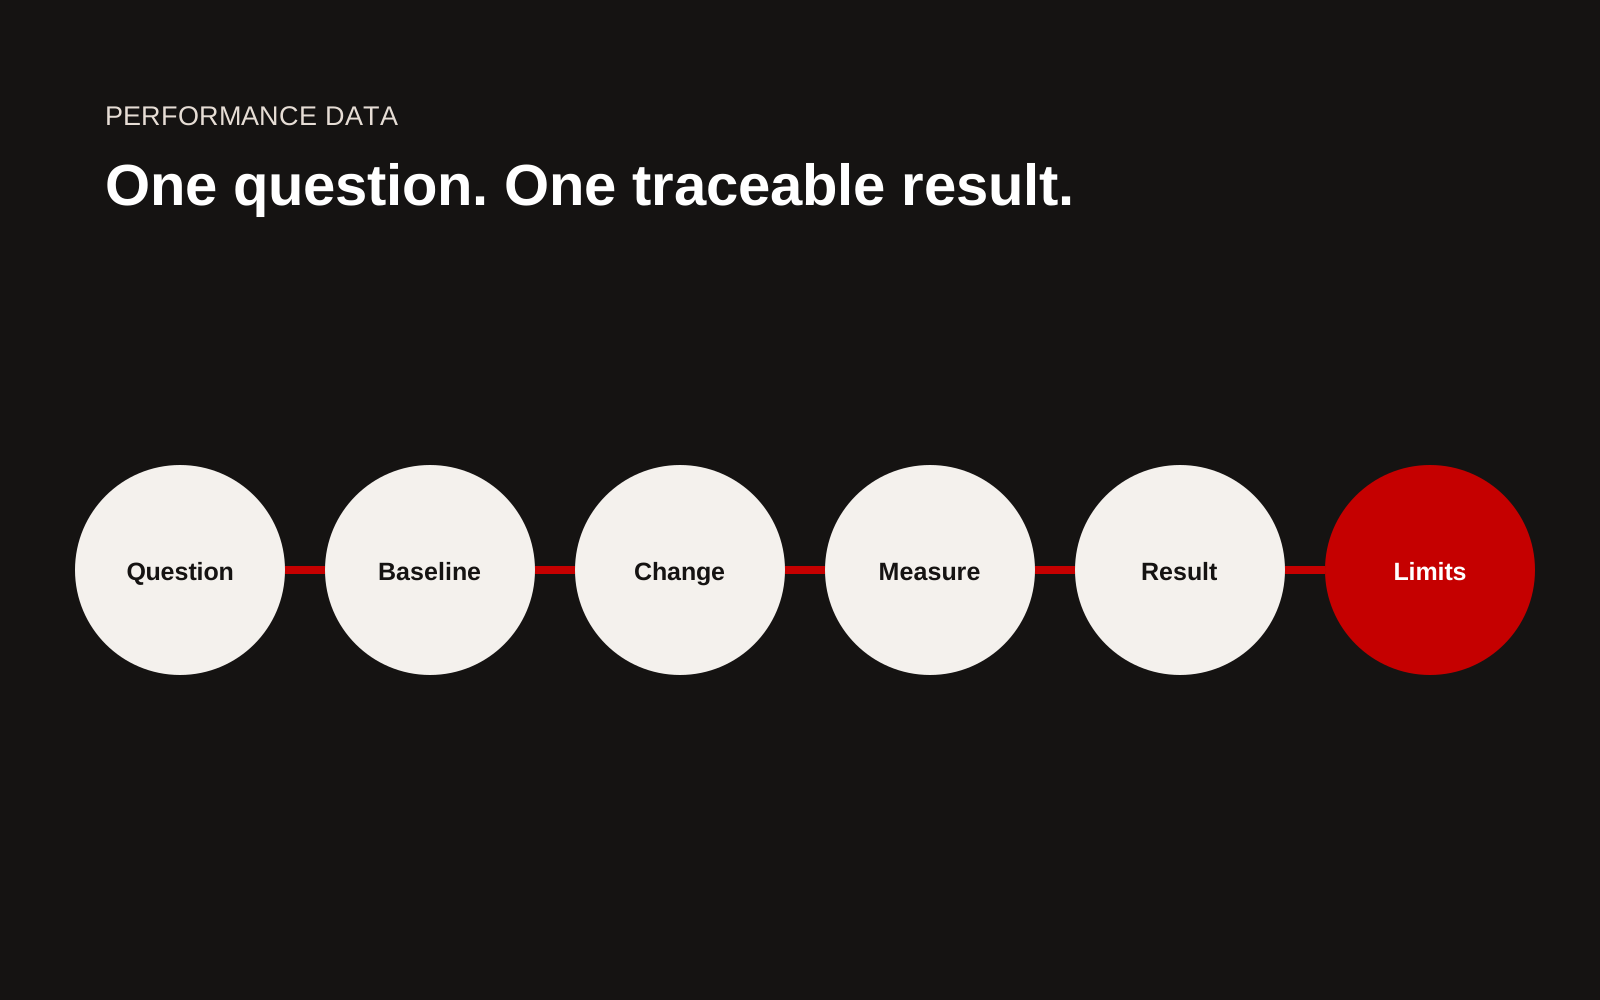
Building performance story sequence from question and baseline through intervention, measurement, result and limitation.
Choose one main question
Examples include:
- Did heating energy per occupied hour change?
- Did peak electrical demand fall after controls work?
- Did indoor temperature remain within the agreed range during a stated period?
- Did water consumption per user change after the intervention?
Avoid combining energy, carbon, comfort and cost into one success claim unless each has a clear method.
Define the boundary visually
Use a simple diagram showing the building, zone, meters, systems and excluded loads. State whether data covers landlord services, tenants, process loads or a whole site.
A whole-building bill should not be used to claim one system's performance when other loads changed materially.
Establish the baseline
Show dates, meter coverage, operating hours, occupancy, weather and abnormal events. If a model or engineering estimate fills a gap, label it.
Use a table:
| Variable | Baseline period | Reporting period | Treatment |
|---|---|---|---|
| Occupancy | Recorded value | Recorded value | Normalise or explain |
| Operating hours | Schedule and actual | Schedule and actual | Compare same boundary |
| Weather | Stated source | Stated source | Adjust where justified |
| Energy | Meter and unit | Same meter and unit | Check completeness |
Describe the intervention
Give the installed scope, completion date, commissioning and later tuning. If several measures were delivered together, do not attribute the full outcome to one product.
Explain controls changes because they can influence results as much as equipment. State the point when operation stabilised and the reporting period began.
Turn data into one honest chart
Use units, dates, source and method directly on the graphic. Show missing periods instead of drawing a continuous line. If data is adjusted, distinguish measured and adjusted series.
Do not use a truncated vertical axis merely to make a small change look dramatic. A table may be better when only two comparable values exist.
Put the limitation near the result
If occupancy fell, weather differed or the monitored period was short, place that note beside the headline. This helps a buyer judge transferability.
France's Éco Énergie Tertiaire guidance and OPERAT platform provide official context for qualifying tertiary-building energy reporting. A project story should not claim regulatory performance beyond the owner's complete record.
Create a claim approval sheet
Store every published number, source file, formula, reviewer, client permission and wording. Keep raw data controlled. Give the page a review date when the measurement period is ongoing.
Show data quality without overwhelming the reader
State missing periods, estimated values, sensor changes and the proportion of data excluded. Put the detailed method in a downloadable technical note when the main case study would become unreadable. The headline should still include enough context to prevent a false conclusion.
If data comes from a building management system, identify the point names, units and aggregation used in the analysis record. A display label can change while the underlying sensor remains the same, or two points can appear to measure the same load. Technical review should resolve those ambiguities before publication.
Connect the outcome to the next decision
Explain what the result changed: controls were retained, another phase was approved, a maintenance issue was found, or additional monitoring was required. This gives the number a business purpose.
Do not force a positive ending. A result that fails to meet the design estimate can still demonstrate useful diagnosis, correction and learning when the project team approves the account.
Data-story checklist
- One decision question leads the story
- Building and system boundary clear
- Baseline and reporting periods stated
- Meters, sensors and units identified
- Occupancy, hours and weather considered
- Installed work and commissioning described
- Measured, adjusted and modelled values separated
- Chart includes source and date
- Limitation placed beside the result
- Client and technical approval recorded
Create a reproducible chart note
Every published chart should have a short companion note. Record the data source, collection period, sampling interval, excluded periods, calculation method, unit, baseline rule, weather or occupancy treatment, author and approval date. Store the query or workbook used to produce the final values.
Ask a second person to reproduce the headline number from the source. If they cannot, the issue may be a missing filter, an undocumented manual adjustment or a definition that only the analyst understands. Fix the record before polishing the graphic. Give the reader enough context to interpret the trend, but keep operationally sensitive raw data controlled. When the building, meter configuration or reporting method changes, mark a break in the series rather than presenting one continuous line. A modest, traceable chart is more useful than a dramatic result that cannot survive a buyer's technical review.
Creatif Work builds construction websites where project data remains understandable outside the technical report. Through our website service, firms can turn approved performance records into clear case studies without stripping away the conditions that make the result credible.