

An AI-Written SEO Report Is Not an Analysis

AI can write an explanation faster than a person can verify it. That does not make the explanation an analysis. A useful SEO report needs a defined dataset, checked calculations, relevant segmentation, competing explanations and a decision supported by the available evidence. A fluent paragraph cannot substitute for those steps.
You open the monthly report. Organic clicks rose by 50%. The accompanying paragraph says the content strategy has improved buyer engagement and that further publishing should increase leads. It sounds reasonable. But the report has not shown which pages grew, who enquired or what changed outside the publishing programme.
This guide works through that gap. We use a fully synthetic dataset to demonstrate the checks. None of its figures describes a client, Creatif Work performance or an industry benchmark. The numbers are deliberately simple enough to reconcile by hand. The reasoning is useful when your actual data is more complicated.
Download the report-analysis workbook or CSV template and data pack. The synthetic dataset is included so you can inspect the calculations instead of accepting the chart on trust.
What AI can help with and what it cannot establish
AI can assist with drafting, classification and organising an investigation. It can suggest plausible explanations for a movement in a chart. The problem begins when a plausible explanation is presented as a verified cause.
An AI system does not know that your tracking changed unless that fact is supplied or investigated. It does not know that a prospect was unsuitable unless the qualification record says so. It may confidently describe a content programme as successful because the prompt asks for an upbeat summary.
Google's generative AI content guidance stresses accuracy and review rather than a blanket prohibition on AI. That distinction matters. The concern here is unsupported reporting, not the mere presence of a writing tool.
The same standard applies to a human-written report. A person can make identical errors without AI. Human authorship is not proof of sound analysis. Someone must take responsibility for the data, assumptions, explanation and decision.
Demand a finding rather than a mood
“Performance is encouraging” expresses a judgment without saying what it rests on. A finding says which measure changed, for which group, over which period, and what has been checked. It is possible for the finding to be positive while its commercial implications remain unknown.
For example, an engineering article may receive more visits from students. That can be useful for recruitment or education. If the appointment is intended to attract engineering buyers, the report needs a separate assessment. “More engagement” does not answer the commercial question.
Ask the writer to distinguish facts, hypotheses and recommendations. Those labels make a report easier to challenge constructively. They also prevent a recommendation from appearing to be an inevitable consequence of a single chart.
Define the synthetic example before calculating
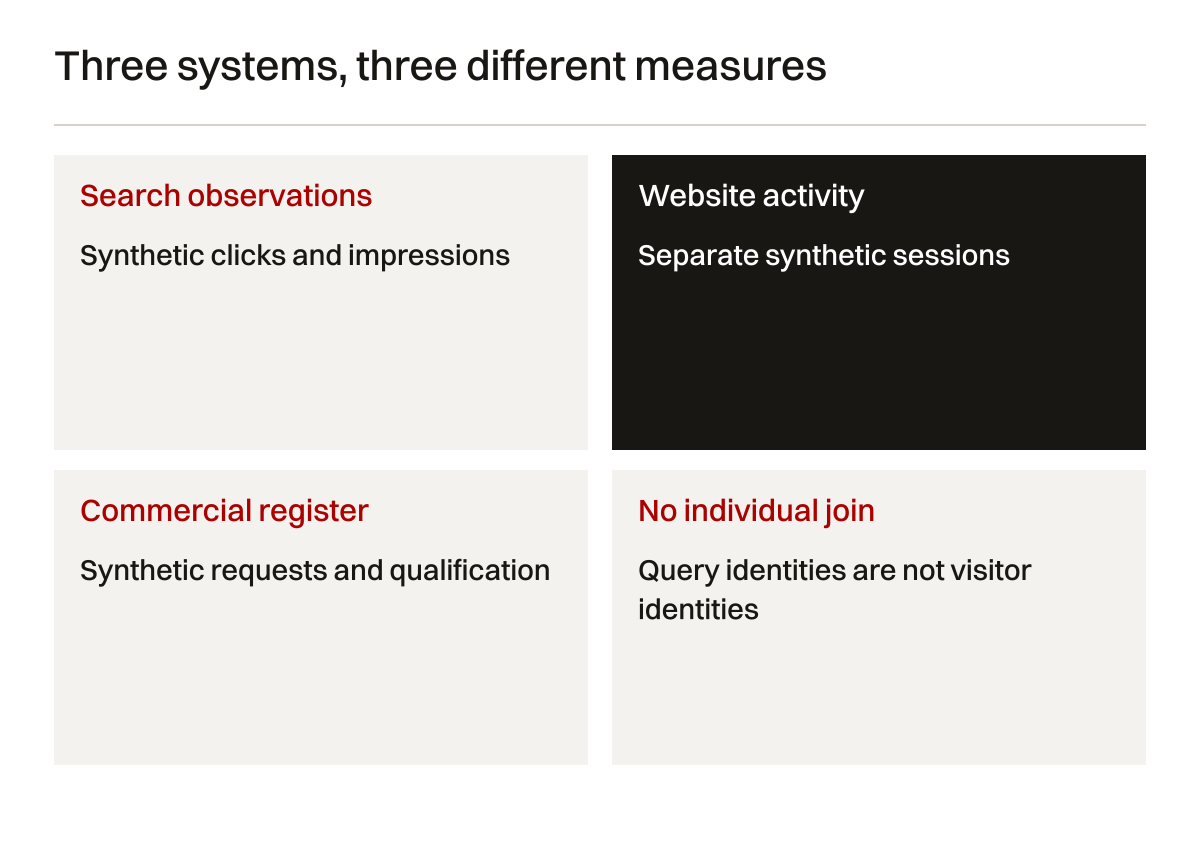
Our example compares two equal-length reporting periods called Before and After. There are three mutually exclusive reporting segments: branded discovery, service selection and general information. The example uses constructed aggregates, not extracted query-level data.
Search clicks and impressions represent synthetic Search Console-style observations. Website sessions represent a separate synthetic analytics-style dataset. Received requests and qualified enquiries represent a fictional commercial register. These are different measures. They are not a row-by-row identification of searchers.
Each session, request and qualified enquiry is assigned to one example segment for teaching purposes. In an actual business, joining those records may be incomplete or impossible. Search Console queries do not provide individual visitor identities. Do not copy the synthetic linkage as a claim that every search query can be tied to a person.
The qualification rule in this example is a real prospective project that matches the fictional company's service and delivery area. Recruitment messages, supplier offers and unsupported requirements are excluded. A repeated request is counted once. The example assumes that definition is unchanged across periods.
| Period and segment | Impressions | Clicks | Website sessions | Received requests | Qualified enquiries |
|---|---|---|---|---|---|
| Before: branded | 10000 | 600 | 540 | 9 | 6 |
| Before: service | 10000 | 300 | 270 | 18 | 12 |
| Before: information | 10000 | 100 | 90 | 3 | 0 |
| After: branded | 15000 | 900 | 780 | 9 | 6 |
| After: service | 12000 | 240 | 208 | 12 | 8 |
| After: information | 30000 | 360 | 312 | 3 | 0 |
Every value in this table is synthetic. Period totals are sums across the three mutually exclusive example groups. No conclusion about an actual business follows from them.
Keep your actual export less tidy if it is less tidy
Real records often include unknown source, missing qualification and incomplete exports. Preserve those states. Replacing unknown values with zero makes the report look cleaner but changes its meaning. A blank qualification field is not proof that a request was unsuitable.
If you cannot link a request to a landing page, retain it as unassigned. Explain what proportion remains unassigned. Do not allocate it to the best-performing content merely because the prospect mentioned finding the business online.
The synthetic example is designed to teach arithmetic and interpretation. It is not a proposed data architecture. A real measurement plan needs permissions, collection definitions and a proportionate way to connect marketing observations with commercial records.
Reconcile the totals before writing the summary
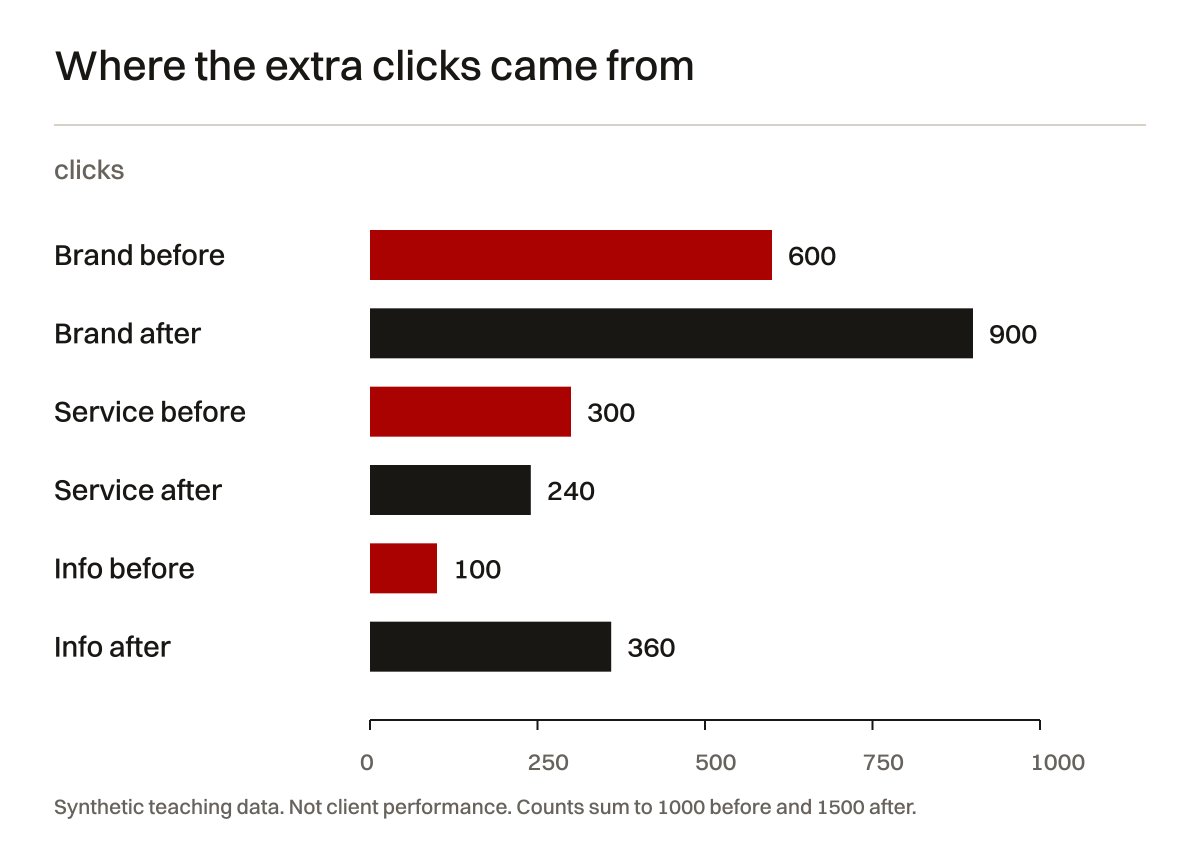
Before clicks total 600 plus 300 plus 100, which is 1,000. After clicks total 900 plus 240 plus 360, which is 1,500. The increase is 500 divided by 1,000, or 50%. That headline is arithmetically correct.
Before impressions total 30,000. After impressions total 57,000. The increase is 27,000 divided by 30,000, or 90%. Do not average the three segment growth percentages to produce the total. Use the summed counts.
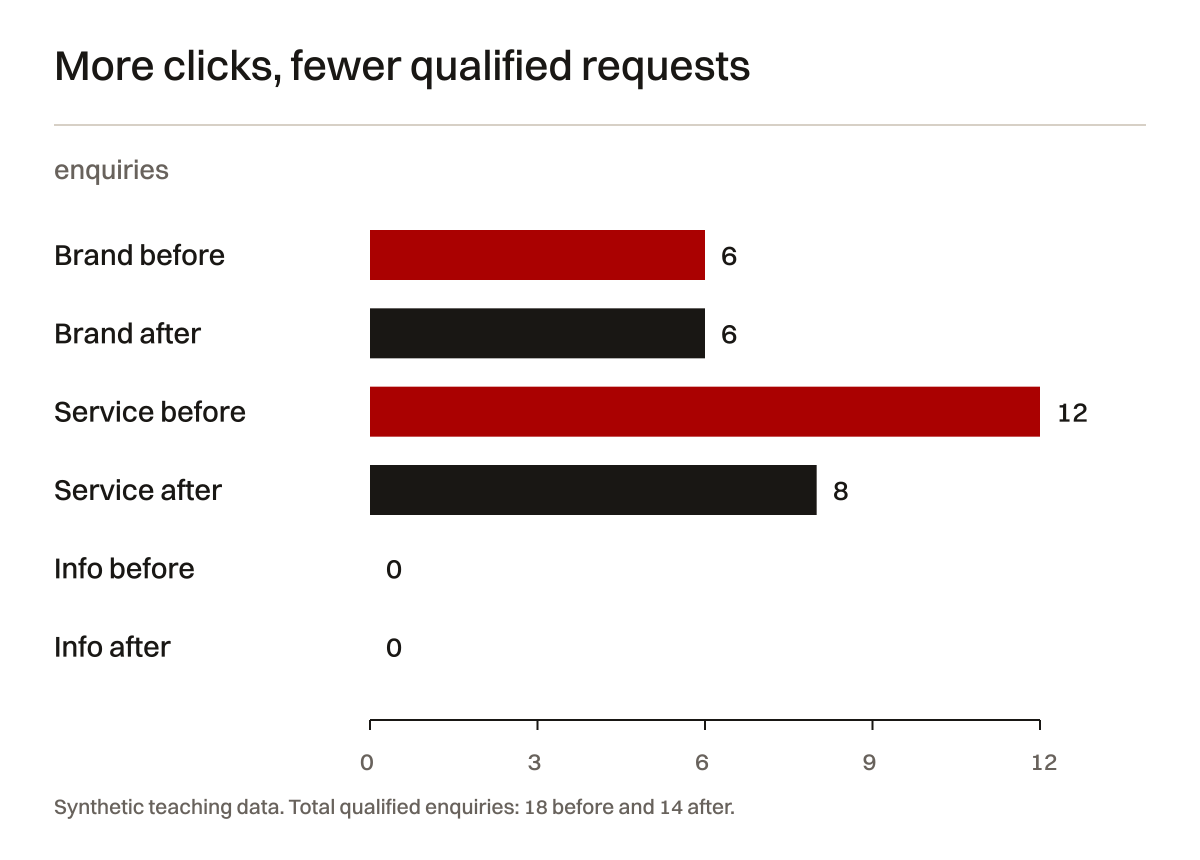
Website sessions rise from 900 to 1,300. Received requests fall from 30 to 24. Qualified enquiries fall from 18 to 14. The dataset therefore contains more observed search activity alongside fewer commercial requests under its stated definitions.
Google's Search Console metric definitions explain that click-through rate is clicks divided by impressions. For the total example, that is 1,000 divided by 30,000 before, or 3.33%. After, it is 1,500 divided by 57,000, or 2.63%.
Use weighted rates, not averages of rates
The three Before segment click-through rates are 6%, 3% and 1%. Because their impressions are equal, their simple mean happens to equal the total rate. After impressions are unequal. Averaging 6%, 2% and 1.2% gives about 3.07%, not the correct total of 2.63%.
That difference is not cosmetic. The larger information segment changes the denominator. A report that averages percentages without their base counts can tell a different story from the underlying dataset.
Retain numerator and denominator columns in the workbook. Calculate a rate only after checking both. Keep rounding for display, not as the basis for the next calculation. A rounded chart label should not be re-imported as a precise analytical value.
Separate growth from the growth you wanted
The service segment falls from 300 to 240 clicks, a reduction of 20%. Qualified enquiries in that segment fall from 12 to 8. Branded clicks rise by 300 while branded qualified enquiries remain six. Information clicks rise by 260 while information qualified enquiries remain zero.
These observations challenge the claim that more overall clicks demonstrate better buyer acquisition. They do not prove that the new informational content harmed the business. Other factors could explain the service decline. The dataset lacks the evidence needed to establish causation.
The increase in branded clicks might reflect a campaign, referral activity or a public announcement. Those are hypotheses. The example does not include an event record establishing any of them. Do not turn a plausible business story into an invented fact.
Similarly, information visitors could return later or share an article with a buyer. That possibility is not measured here. It should not be dismissed, but it should not be booked as a sale. Keep both the potential value and the missing evidence visible.
| Headline | Checked calculation | What it supports | What it does not support |
|---|---|---|---|
| Clicks rose 50% | 1000 to 1500 | Total example search clicks increased | Suitable demand increased |
| Impressions rose 90% | 30000 to 57000 | Total example exposure increased | Every page became more effective |
| Sessions rose 44.4% | 900 to 1300 | Recorded example sessions increased | Clicks and sessions are interchangeable |
| Requests fell 20% | 30 to 24 | Fewer unique example requests arrived | SEO alone caused the reduction |
| Qualified enquiries fell 22.2% | 18 to 14 | Fewer requests met the unchanged rule | Revenue necessarily fell by the same amount |
These calculations describe only the synthetic dataset. The percentages are rounded to one decimal place where needed. Commercial outcomes are not derived from search counts.
Inspect mix changes before recommending more volume
The service segment contributes 30% of Before clicks and 16% of After clicks. Its share fell because its count declined while other groups grew. That is a useful description, not evidence that search platforms deliberately favoured the wrong audience.
The agency's next decision should focus on the service group. Which pages and query themes changed? Were scope, availability or collection conditions different? Did a competing result answer the buyer more clearly? Those questions require records absent from this example.
Publishing more general information might still be worthwhile for another purpose. It should have that purpose stated. A traffic target should not quietly replace the original goal of suitable service enquiries because it is easier to increase.
Write the weak summary and then correct it
A weak synthetic summary would say: “Organic clicks increased by 50%, showing that our content strategy attracted more high-intent buyers. We recommend increasing production to maintain momentum.” The first clause is supported. The rest is not established by the supplied data.
A defensible summary would say: “Total clicks increased from 1,000 to 1,500. Growth came from branded and information segments. Service clicks fell from 300 to 240, while total qualified enquiries fell from 18 to 14. We should investigate service-page demand, search appearance and enquiry handling before expanding production.”
The corrected version is not negative for the sake of sounding sceptical. It preserves the good observation and examines the commercial problem. It also identifies what must be checked before spending more effort.
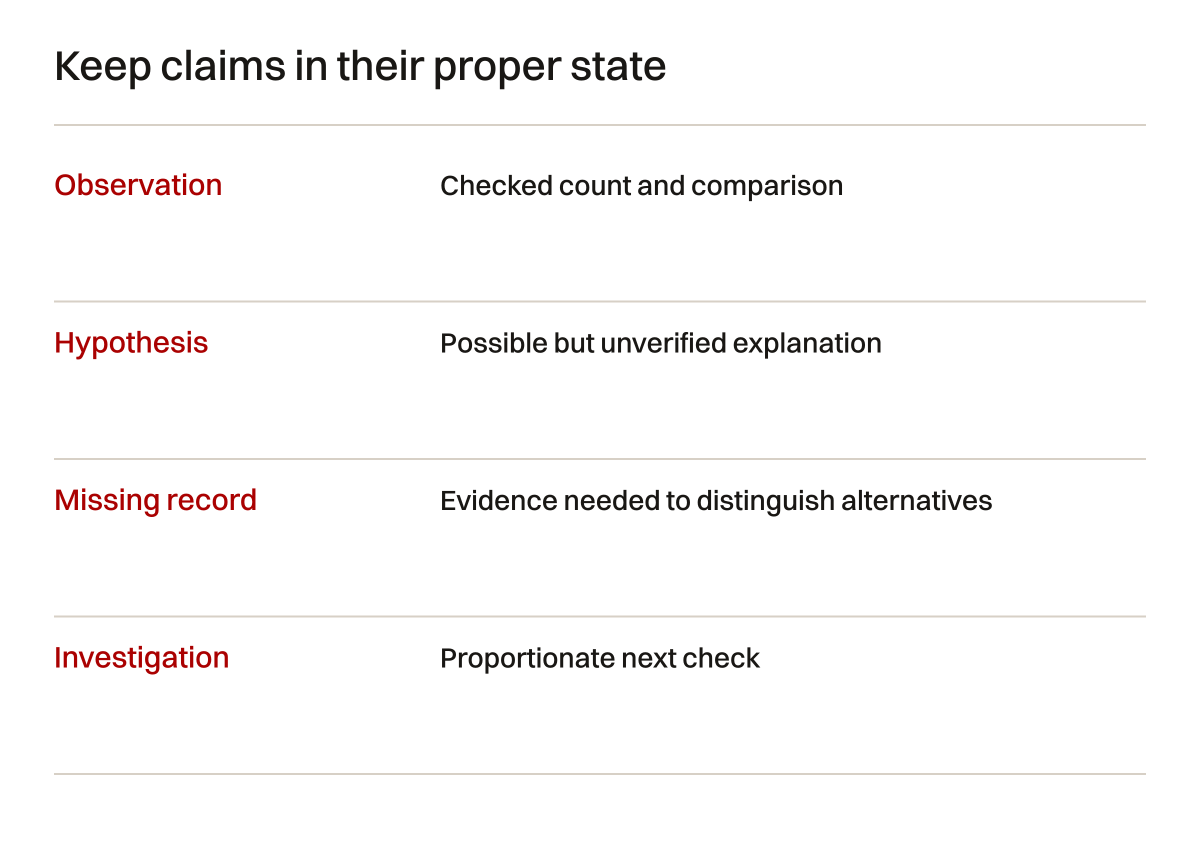
Reject implied certainty in the verbs
Words such as “caused”, “drove” and “proved” make stronger claims than “coincided with” or “was observed after”. Choose them according to the study design, not according to the desired sales tone.
You may have evidence that a broken form was repaired and subsequently received requests. That is a credible operational finding. It still may not prove the exact number of incremental requests caused by every page change in the same period.
An analysis can support action without complete causal certainty. If an important service page lacks accurate scope, correcting it can be sensible on inspection alone. Be clear that the decision addresses a found information gap, not a measured revenue lift that has not occurred.
Check how the data was collected
Before interpreting a decline, inspect the measurement conditions. Did consent behaviour change? Were analytics tags altered? Did the form event begin firing on button clicks instead of successful submissions? Did the receiving team change its qualification rule?
The Search Console report overview documents report dimensions and aggregation. Analytics sessions are collected through a different system. They should not be expected to equal Search Console clicks exactly.
Use a small test plan. Submit a permitted test enquiry through the actual visitor route. Check confirmation, event behaviour and delivery to the designated receiver. Label the test so it does not become a prospect record. Obtain permission before touching a live customer system.
Investigate records around known release dates. A reporting break that begins exactly when tracking changed needs a collection explanation before a demand explanation. The timing is a clue, not proof of the cause.
| Check | Evidence to obtain | Possible reporting distortion | Responsible role |
|---|---|---|---|
| Export scope | Property, dates, search type and filters | Different populations compared | Search analyst |
| Event definition | Actual firing condition and test | Click counted as completed request | Analytics implementer |
| Consent change | Release record and collection settings | Recorded sessions change without equal demand change | Site and privacy owners |
| Qualification | Written rule and sample review | New labels create an apparent lead decline | Commercial owner |
| Duplicates | Protected request identifiers | Repeat messages inflate totals | Receiving team |
| Page changes | Live URLs and deployment dates | Recommendation detached from actual implementation | Site owner |
This is an investigation checklist. It is not evidence that any specific error occurred. Record “not inspected” until the relevant check is completed.
Look for alternative explanations in a deliberate order
Start with collection because a broken measure can contaminate every later conclusion. Then inspect business changes and demand. Finally inspect page groups and search appearance. You can investigate several branches together, but keep their evidence separate.
Google's traffic-drop investigation guidance describes different possible causes and ways to examine affected groups. A drop is not automatically an algorithm penalty. An algorithm update occurring nearby is not a diagnosis by itself.
For an engineering firm, service availability may have changed. For construction, a tender cycle may have ended. For marine work, a capability page may attract research interest without a current commercial appointment. These are examples of questions to investigate, not assumptions about your market.
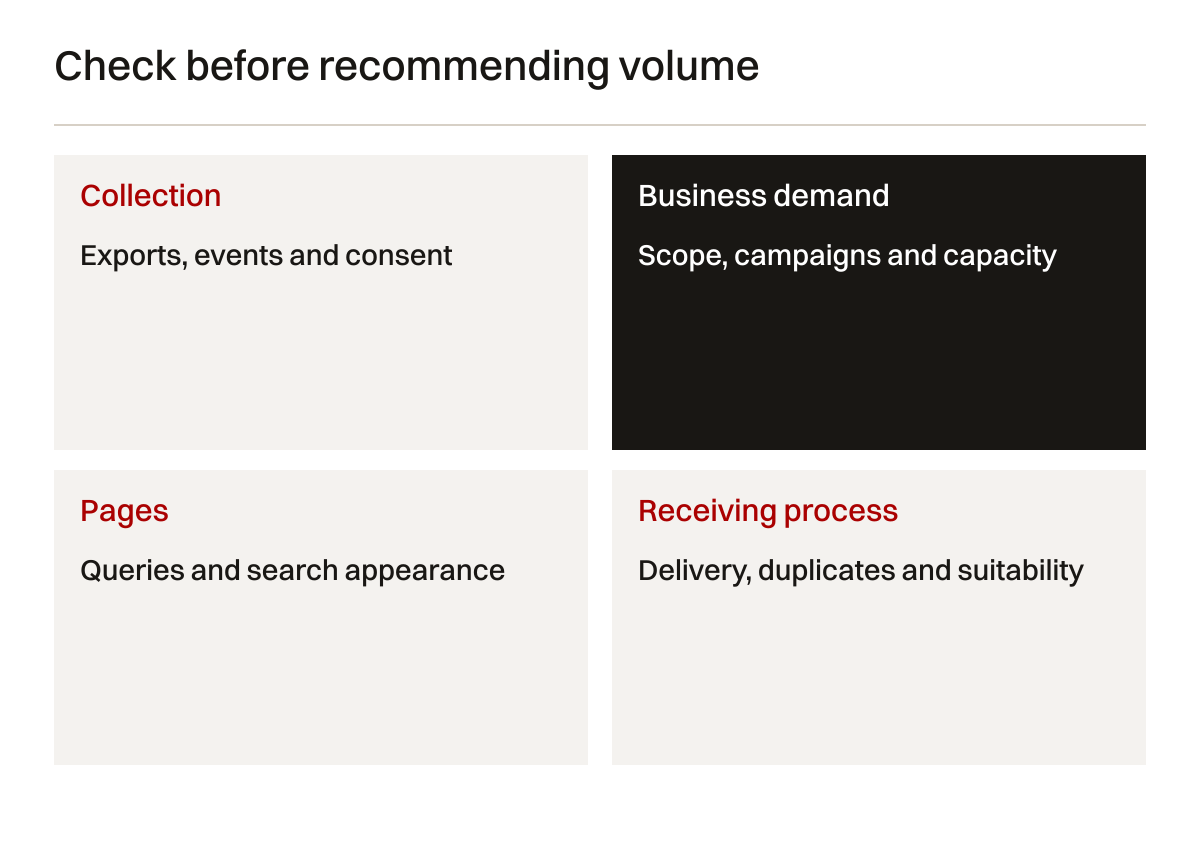
Define a test that could disprove your preferred explanation
If you think unclear service scope is the problem, inspect suitability reasons in actual enquiries and compare the page with approved facts. If prospects understand the scope and the relevant traffic has vanished, a copy rewrite alone may not address the main issue.
If you think lower demand explains the decline, compare the affected themes with external interest and the business's other channels. Different data sources have different audiences and limits. Agreement is informative but not conclusive proof of a single cause.
Write what would change your view. That small step makes a recommendation more accountable. Without it, the provider can reinterpret every later outcome as confirmation that its original theory was right.
Understand why AI-search screenshots need another method
An SEO report may include an AI answer that mentions your company. That can be a real observation. It is not a market-share statistic unless there is a defined population and sampling method supporting that claim.
Google's AI-features guidance describes eligibility and reporting for its search features. It does not offer a special file that guarantees inclusion. A provider should not present a standard technical implementation as a secret route to guaranteed AI recommendations.
Ask whether the prompt named the business, included favourable context or followed an earlier conversation. Ask how many times it was repeated and whether omitted answers remain in the sample. The prompt's construction can determine what the observation means.
Pew's study of Google AI-summary clicks examined browsing data from 900 US adults in March 2025. It observed fewer traditional-result clicks when an AI summary appeared. That is useful context, not a Singapore industrial benchmark or proof explaining your site's particular decline.
Keep citation, referral and commercial value separate
An answer can cite a technical article because it explains a concept. That does not mean it recommends the article's publisher as a supplier. A visitor can arrive from that citation without having a project. A suitable buyer can discover the business through several channels before enquiring.
Report each observable layer separately. A stable sample of prompts can support a sample citation rate. Referral analytics can show recorded visits under stated collection limits. The commercial register can show actual requests and their fit. Do not merge those layers into “AI revenue” without a defensible link.
This distinction protects useful AI-search work from inflated claims. A correction to wrong company facts in sampled answers can be valuable. It should be reported as a factual accuracy task rather than automatically valued as a pipeline increase.
Turn a recommendation into a checkable decision
A recommendation should identify the problem, evidence, proposed action, owner and verification. It should explain why that action comes before another. “Publish more” is incomplete unless the report identifies useful unanswered questions and the evidence needed to answer them.
Google's people-first content guidance is relevant when assessing content purpose. Use it to challenge pages made primarily to fill a quota. It does not provide a universal article length or publishing frequency that guarantees success.
In the synthetic example, an appropriate decision is to investigate the declining service segment. A content brief may follow if the investigation finds an unanswered appointment question. A measurement repair may come first if request counts cannot be trusted.
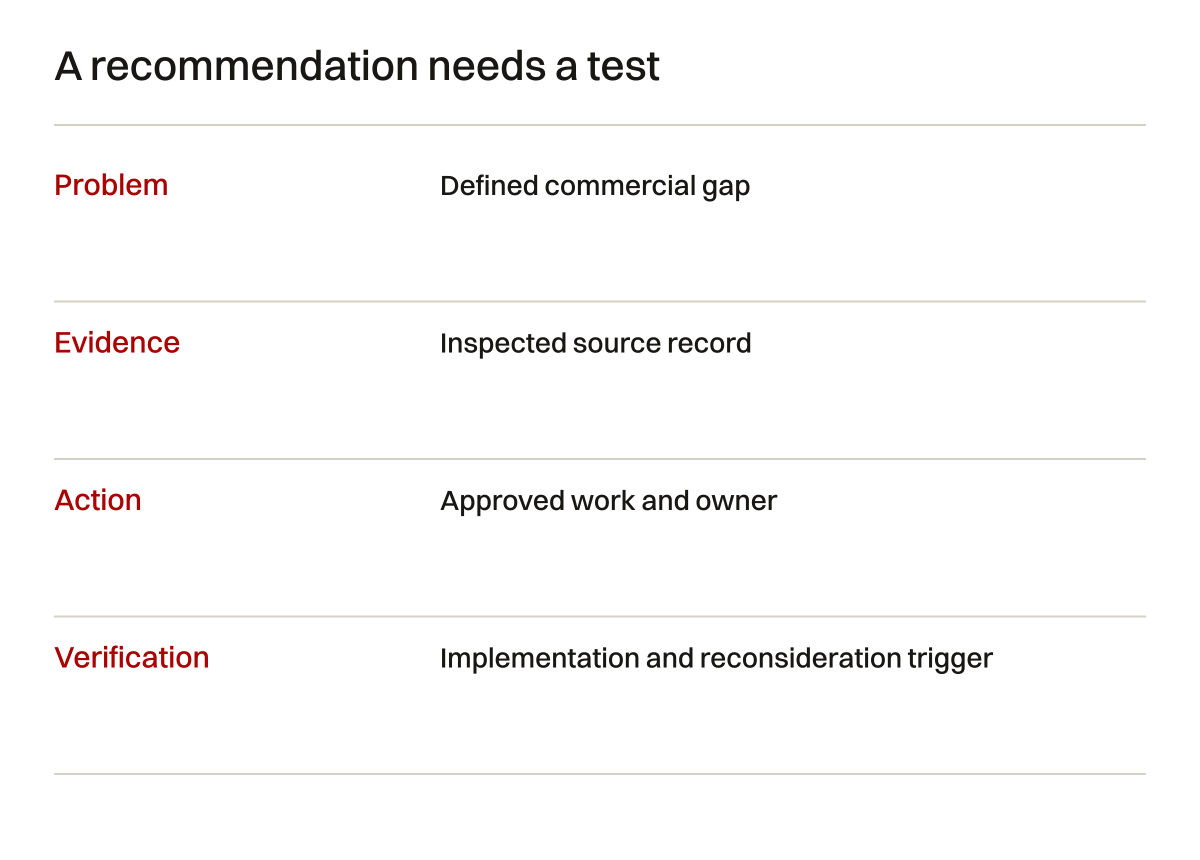
| Proposed decision | Evidence currently available | Missing evidence | Next action before approval |
|---|---|---|---|
| Expand information publishing | Information clicks grew | Commercial purpose and useful question list | Define the intended benefit |
| Rewrite service pages | Service clicks and enquiries fell | Page inspection and suitability reasons | Review actual scope and buyer questions |
| Repair measurement | Different systems have different totals | Event and delivery checks | Run an authorised test |
| Claim content caused growth | Aggregate click increase | Causal evidence and alternative explanations | Do not make the claim |
| Continue observing | Two synthetic periods | Longer, comparable real records | Define the next review basis |
The missing evidence column is not an excuse for doing nothing. It identifies the smallest useful investigation before an expensive or irreversible change.
Assign actions to the right people
The analyst can reconcile figures and inspect search groups. The developer can check events and forms. The service owner can approve capability facts. The commercial team can classify enquiries. One person may hold several roles, but the responsibilities still differ.
AI can assist each role with a bounded task. It should not silently assume authority to approve technical scope or interpret private sales records. Keep approval and data handling explicit.
For a construction website, an inaccurate project-responsibility claim needs the project owner's correction. For an engineering website, a compatibility statement needs appropriate technical checking. For a marine service, a coverage promise needs operations approval. SEO wording cannot validate those business facts.
Set rules for an AI-assisted reporting workflow
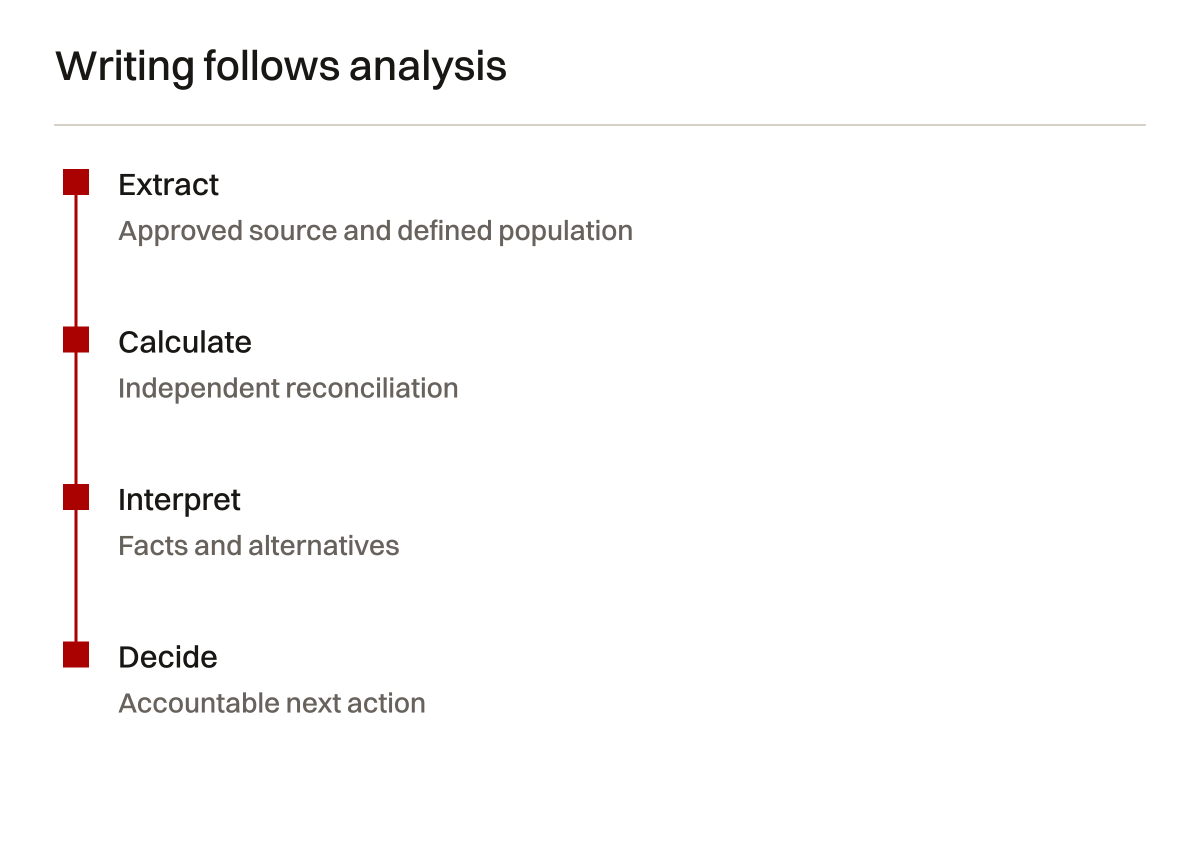
Start with a defined export and record its origin. Remove information the tool does not need. Keep the original source unchanged. Calculate headline measures independently before asking the writing tool to explain them.
Supply the model with the definitions, comparison conditions and known limitations. Ask it to identify possible explanations rather than declare a cause. Require every proposed finding to point to a record. Then inspect the output against the export and business context.
Use Google's hiring guidance when evaluating the provider's explanations. It encourages scrutiny of recommendations and warns about guarantees. An agency should be able to discuss its method without claiming special access to search-platform decisions.
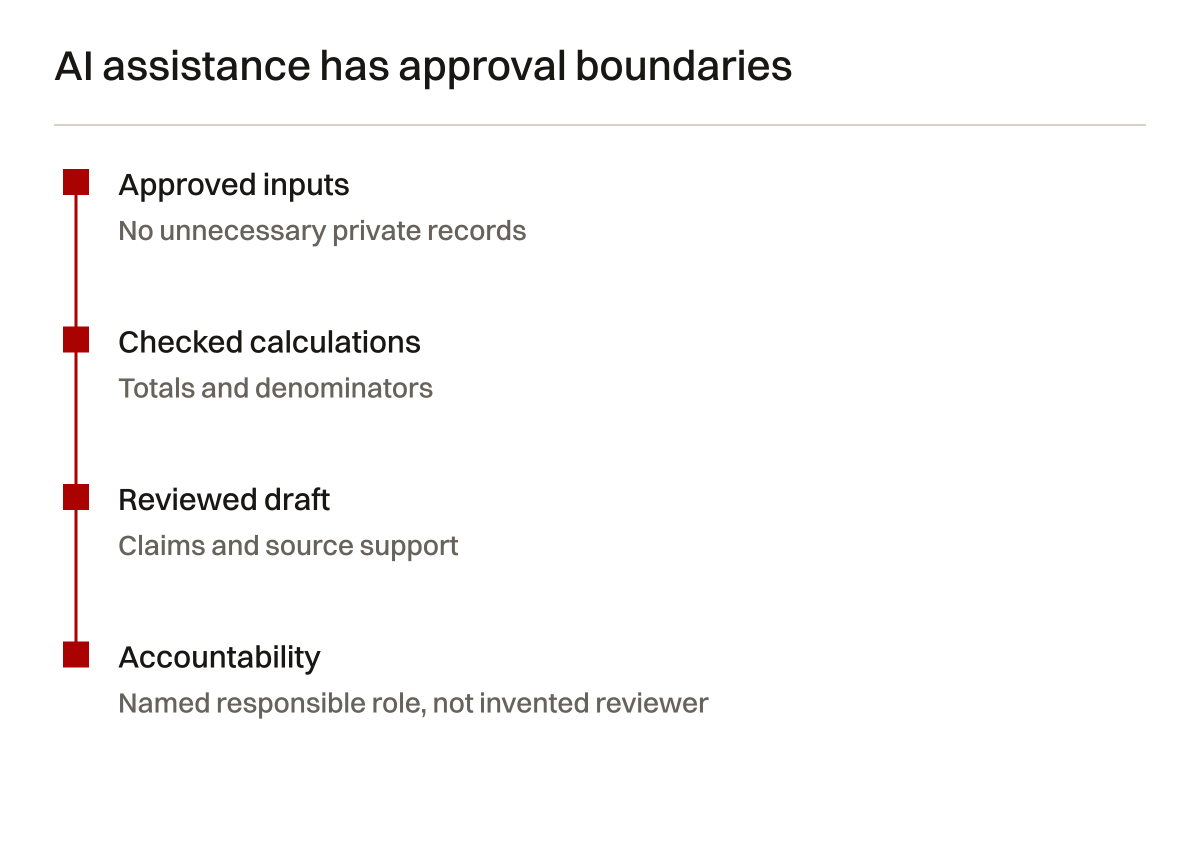
Do not confuse a source list with verification
A generated source list may contain relevant links and still fail to support the sentence beside it. Open the material. Check the exact claim, conditions and date. A citation to attribution documentation does not prove a campaign caused revenue.
Maintain a source register for material platform statements. Keep original interpretation distinct from sourced requirements. The guide's source records were reviewed on 3 October 2026. Platform documentation can change, so recheck it before making an implementation promise later.
Do not describe a report as independently reviewed unless that review happened. Do not add a fictional analyst name to make the document look authoritative. Credibility comes from inspectable work, not from invented approval.
Review the report in a meeting that reaches a decision
Begin with the commercial question. Reconcile the headline figures. Examine the affected segments. Check unresolved collection issues. Then decide what to investigate or change. This order prevents a meeting from becoming a tour of attractive graphs.
Ask the provider to show one uncomfortable result as carefully as one positive result. If a service group declined, it belongs in the report. If the reason remains unknown, say so and define the next check. Hiding uncertainty makes future decisions worse.
Retain the meeting's action record. A recommendation is not implementation. A deployed change is not verified delivery. A verified page is not a measured revenue outcome. Each state should be visible so a later report does not treat unfinished work as completed success.
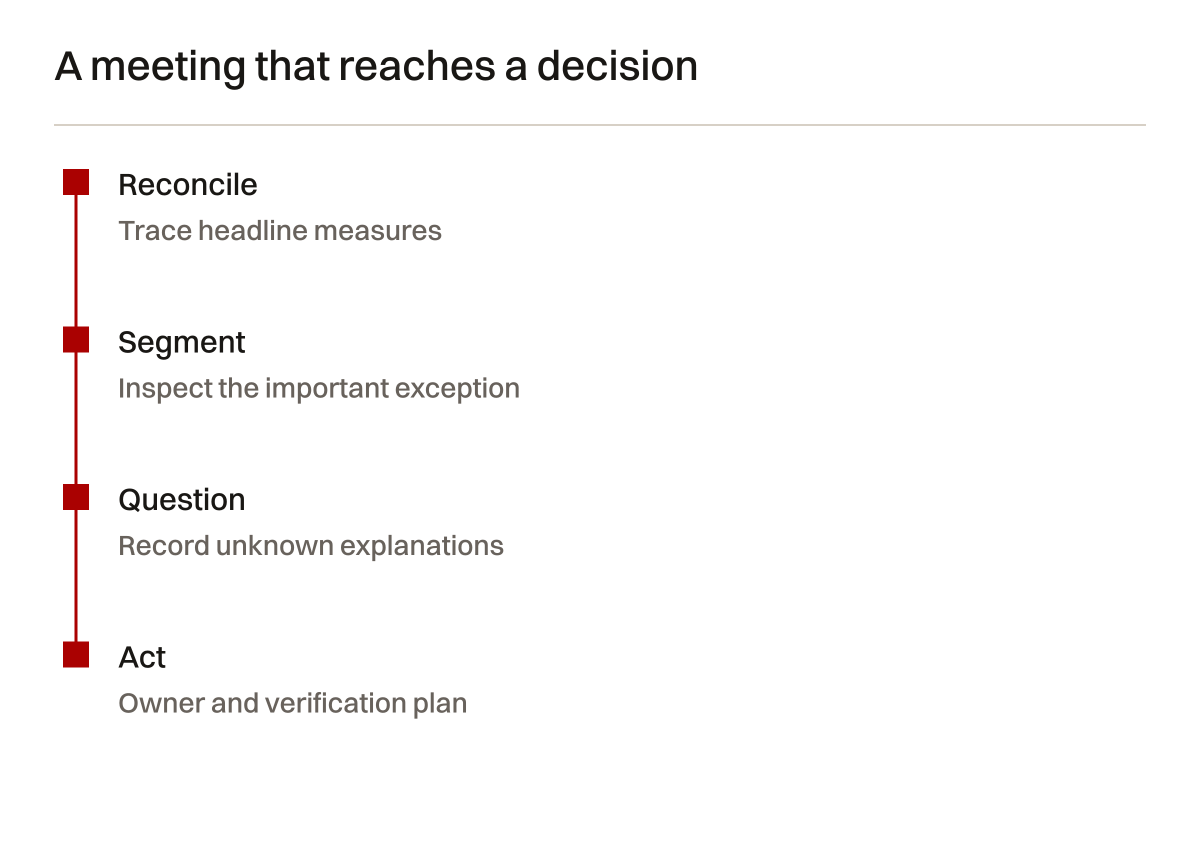
| Review question | Useful answer | Incomplete answer | Record to retain |
|---|---|---|---|
| What changed? | Counts and periods with stable definitions | Percentage without base counts | Export and calculation |
| Where did it change? | Relevant page or intent groups | Site-wide average only | Segment rules |
| What explains it? | Checked facts and labelled hypotheses | Confident untested cause | Investigation record |
| What should happen next? | Prioritised action with owner | Generic publishing recommendation | Decision log |
| How will it be checked? | Defined implementation and review check | “We will monitor performance” | Verification plan |
Use the workbook's blank rows for your actual findings. The example rows are labelled synthetic or illustrative. Do not leave those labels behind when circulating a report that might be mistaken for actual performance.
A board-ready explanation does not need false certainty
Executives often need a short explanation, but short does not mean simplistic. A good summary can state the observed movement, the commercially important exception, the confidence boundary and the next action in a few sentences.
For the example, that summary is straightforward. Total search activity rose. The service segment declined. Qualified enquiries fell under an unchanged definition. The dataset does not establish why. Investigate the service and collection records before expanding output.
If your real report contains a revenue claim, inspect the underlying attribution model. Google Analytics attribution guidance describes how credit is assigned. Model-based credit is not proof of incremental revenue caused by the agency.
For website decisions emerging from that review, our refresh or rebuild discussion explains why a new build is not always the appropriate response. A narrower information or measurement repair may address the actual gap.
Practise the review with three different businesses
Engineering: a popular technical explanation
Consider a fictional engineering company publishing an explanation of a common testing method. The page receives more information visits. The agency proposes several related articles. The commercial team needs appointments for a narrower service with specific operating conditions.
The useful first question is what the existing article helps a buyer decide. Does it explain when the method is appropriate? Does it accurately connect to the service's scope? Does the reader have a route to submit the information required for assessment? The answer may justify a better service connection rather than additional broad articles.
Inspect the enquiry record before making a recommendation. If requests repeatedly ask for work outside the approved scope, review the public explanation. If requests are suitable but the team cannot respond promptly, publishing is not the immediate constraint. If no suitable requests are observed, do not invent them as an indirect consequence of education.
AI can assist with organising those questions. It cannot approve the testing claim or establish which visitor held purchasing authority. Keep the technical owner's approval separate from the marketing interpretation. A clearer article may be a sensible improvement even before its commercial effect can be measured.
Construction: a tender announcement changes the mix
Now consider a fictional contractor whose name appears in a public project announcement. Branded clicks rise. The same period contains a new article campaign. A generated summary gives the campaign credit for overall growth.
Record the announcement as a possible explanation. Review branded and non-branded groups separately. Check whether the article pages actually account for the increase. Do not allocate the growth by whichever channel the agency happens to manage.
Then inspect suitable requests. A project announcement may produce job applications, supplier approaches and genuine client enquiries. Those categories have different meanings. A total inbox count is not a client-acquisition measure. The receiving team needs a consistent classification and a way to mark unresolved records.
The next action might be to clarify project responsibility on the public page and improve the qualification route. It might instead be to continue observing. The correct decision depends on actual findings. The announcement's timing helps form a hypothesis, but a simultaneous event is not automatically proof of its full effect.
Marine: contacts are recorded but delivery fails
Finally, consider a fictional marine service website where the dashboard counts contact-button clicks. The team receives fewer completed requests. The report treats the button event as a lead and recommends more search content.
Test the route before discussing lead volume. Does the form open on the relevant mobile devices? Does submission complete? Do attachments arrive? Does the receiving team recognise the test? A counted interaction can coexist with a failed enquiry process.
If a delivery fault is found, record the affected period and repair verification. Retain the old event definition so the reporting break is understandable. Do not compare historical button clicks with later successful submissions as if the metric had never changed.
After the repair, inspect suitable requests under the new definition. The business may still need better discovery. It now has a more useful basis for deciding. The exercise has not proved a revenue gain; it has removed a known operational fault and made the next review less misleading.
These three scenarios are invented. They illustrate different investigation paths, not a set of results we achieved. Their value is in the questions and records. Replace the fictional facts with approved information before using the examples in a business report.
Ask for the analysis behind the paragraph
We do not object to AI doing some of the work. We object to its output being sold as analysis before the records and reasoning have been checked. A provider should explain its conclusions well enough that you can question them.
Bring the report, available exports and the business question to our SEO and AI-search team. We can discuss what needs investigation before recommending more publishing or a website change. We do not need to pretend the missing evidence already exists.
If the report is polished but the decision remains unclear, Start with the problem. The useful outcome is not a longer summary. It is a clearer basis for deciding what to do next.