

SEO ROI: What a Founder Can and Cannot Calculate

SEO ROI is not organic revenue divided by an agency invoice. A defensible calculation needs an agreed cost boundary, reliable commercial records, a suitable time horizon and a distinction between attributed outcomes and outcomes caused by the work. A planning calculator can show what would need to happen. It cannot prove that those results will happen.
The dangerous version is easy to produce. Take all revenue associated with organic search, subtract one invoice and call the remainder SEO profit. That ignores delivery costs, existing demand, other marketing, internal work and the possibility that some customers would have bought anyway.
This guide builds a more useful business case. It includes a fully hypothetical scenario, break-even calculations, sensitivity checks and a practical record for reviewing real enquiries. The numbers are teaching inputs, not Creatif Work prices, industry benchmarks or client results. No private analytics or CRM data is represented.
Download the SEO business-case workbook or the CSV template pack. Keep the assumptions sheet beside the calculation. A return figure without that sheet is easy to misunderstand.
Use the scenario calculator below to change the teaching inputs. Its output is eventual contribution from the assumed acquisition cohort. It is not cash collected during the acquisition period and is not measured incremental SEO ROI.
Name the question you are trying to answer
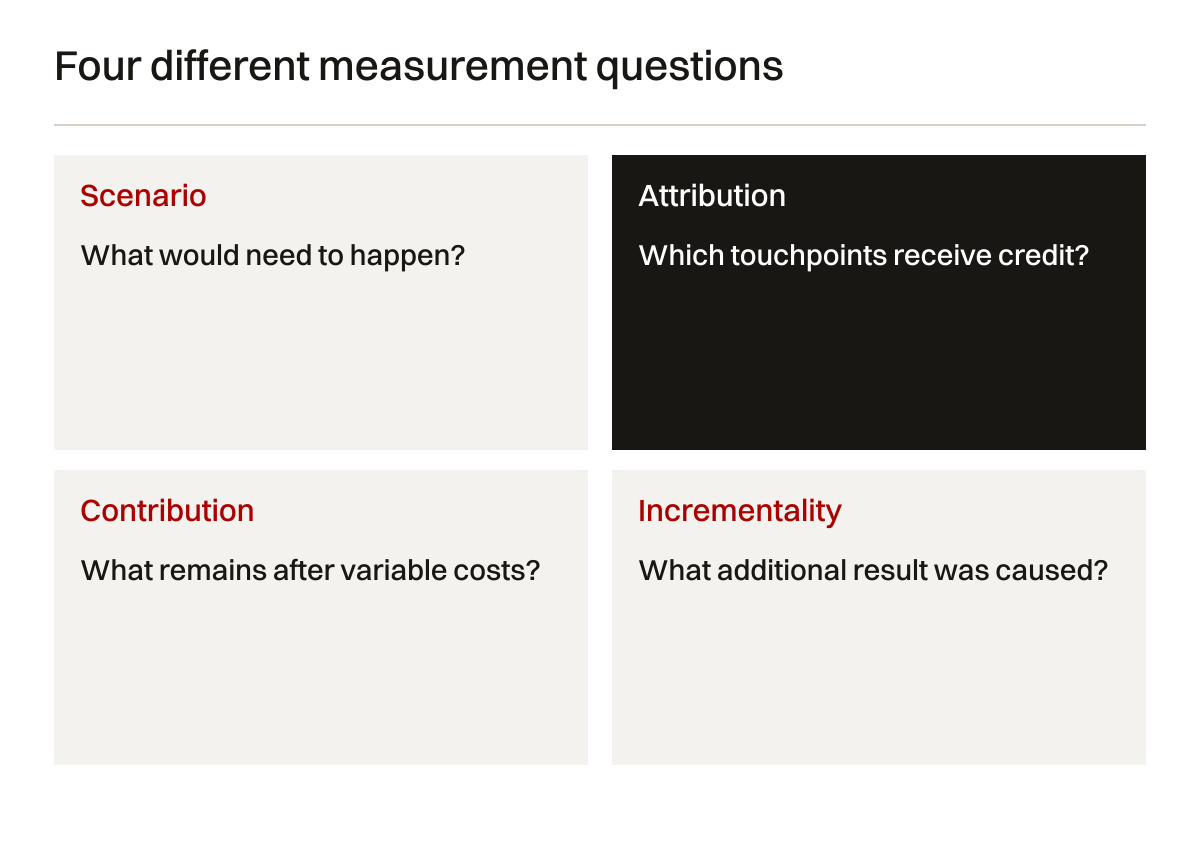
A founder can ask several legitimate questions. Can the business afford a search programme? What lead quality would make it worthwhile? How much contribution is associated with organic enquiries? Did the latest work create additional business? These are not the same question.
The first two are planning questions. The third concerns attribution and record matching. The fourth concerns incrementality, meaning the difference caused by the intervention compared with what would otherwise have happened. A single dashboard does not automatically answer all four.
Begin with a decision statement. For example: “We need to decide whether to continue a six-month search programme for a service with a long buying cycle.” Then identify the evidence needed and the time when it will become available. That is more precise than “prove the value of SEO.”
| Calculation or record | What it can answer | What it cannot establish | Suitable label |
|---|---|---|---|
| Planning scenario | What assumptions make the business case work? | Future performance | Hypothetical scenario return |
| Channel attribution | Which recorded touchpoints receive credit? | Sole cause of a purchase | Attributed commercial outcome |
| Matched enquiry contribution | What contribution came from identified orders? | What would have happened without the work | Observed matched contribution |
| Incremental estimate | What additional outcome is plausibly caused? | Certainty without a sound comparison | Estimated incremental effect |
| Cash record | When did money enter and leave? | Full economic return by itself | Cash-flow position |
Do not substitute a convenient metric
If the business question concerns qualified enquiries, a rising session chart is an intermediate observation. If it concerns cash survival, projected contract value is not cash. If it concerns profitability, top-line revenue is not contribution.
A provider should explain which question their report answers. They can present useful intermediate evidence without claiming it is ROI. “Relevant non-branded discovery improved” may be an honest observation. It becomes misleading when relabelled as “we generated this entire contract.”
For the technical distinction between credit allocation and outcomes, consult Google's attribution settings documentation. The model allocates credit according to its rules. That allocation is not an experimental comparison against a world without the SEO work.
Count costs on the same boundary as benefits
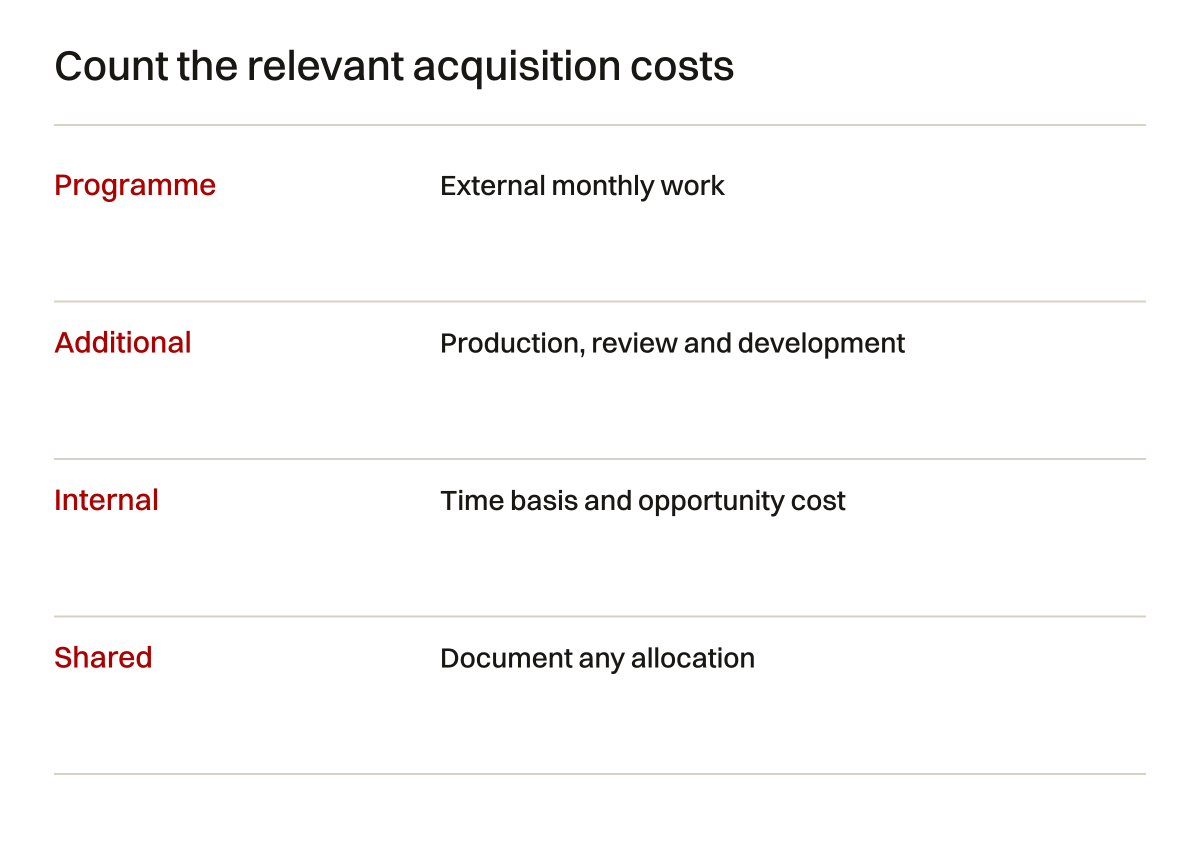
The invoice is rarely the complete cost. Search work can use internal approval time, specialist review, development, design, content production and software. The commercial team may also spend time assessing enquiries. Decide which costs belong in the business case and use that decision consistently.
Avoid double counting. If content production is included in a contracted amount, do not add the same production again as a separate cash expense. If an existing employee's time is included, state how it was valued and what alternative work was displaced. Cash cost and opportunity cost should remain distinguishable.
For a shared website rebuild, allocate costs according to a documented rationale rather than assigning the whole rebuild to SEO only when the result looks favourable. The new site may support paid campaigns, recruitment, customer support and sales conversations too.
Include setup without distorting the comparison
Some costs happen once; others recur. A tracking repair can occur before the programme. A monthly review continues. A service owner's approval time may vary. Record when the cost arises rather than flattening everything into a convenient monthly average without explanation.
The basic scenario below groups monthly programme cost and monthly additional acquisition costs. A real calculation can add a separate setup cost. If you do so, amend the formula and the break-even result. Do not quietly change the model while keeping the original return label.
For a small company, internal capacity can be the binding constraint. An ambitious content plan can consume the only engineer who can verify technical statements. The cost record should make that visible. Otherwise “free internal review” conceals the commercial work that is not being done.
Use contribution rather than all revenue
A sale creates delivery obligations. Materials, subcontracting, variable labour, commissions and other incremental costs can consume a substantial part of the contract value. Contribution is the amount left after the relevant variable costs, before the fixed costs outside that boundary.
Agree the margin definition with the person responsible for the financial records. Do not mix gross margin from one service with contribution margin from another. The spreadsheet should state what was deducted and what remains outside it. This guide is a planning method, not accounting advice.
A marine parts sale and an engineering consultancy appointment can have different cost structures. Applying one company-wide margin to both may hide which enquiries are worthwhile. If service mix changes during the programme, inspect that mix rather than attributing the margin change to SEO.
Existing capacity is not unlimited
A service business may have staff who could take more work without immediate hiring. That does not mean every future contract has zero delivery cost. Capacity eventually runs out. Some jobs require travel, specialist partners or overtime. A scenario should reflect the plausible delivery conditions of the extra business.
Do not include speculative lifetime value merely because the first-contract calculation is weak. Repeat orders can matter when supported by mature customer records. Show the first-contract view separately from a repeat-business scenario. State retention, repeat-order timing and margin assumptions explicitly.
Discounts and cancelled work matter too. Signed contract value can differ from realised revenue and contribution. A reliable review reconciles the records once delivery is complete or at agreed stages. A large opportunity is not profit simply because it appears in a sales pipeline.
Work through a clearly hypothetical scenario
The following model assumes the same qualified-lead rate and win rate throughout six acquisition months. It values the resulting contracts using a constant contribution margin. It does not account for a delayed ramp, varying service mix, payment delay, tax or the timing of delivery. Those limitations are deliberate and visible.
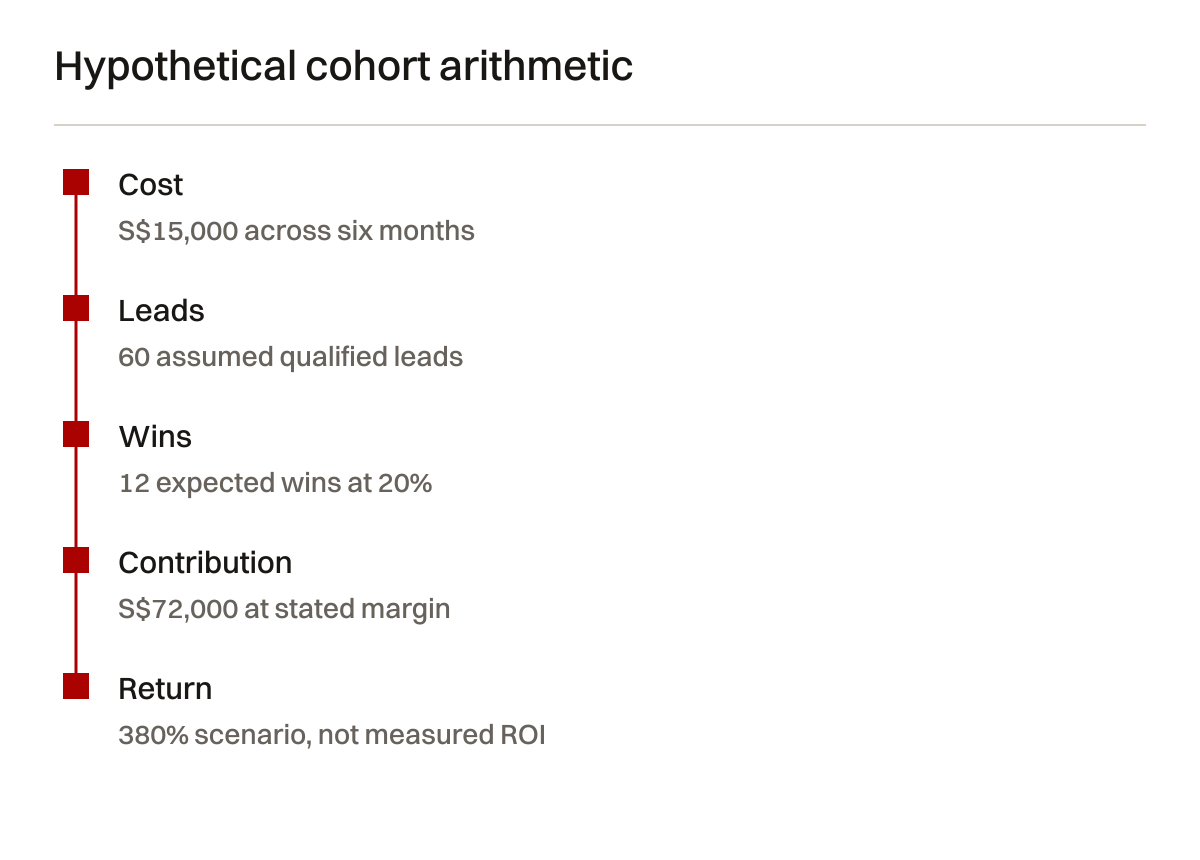
Assume monthly programme cost of S$2,000 and additional monthly acquisition costs of S$500. Assume ten qualified leads per month, a 20% win rate, S$20,000 contract value and 30% contribution margin. These are invented inputs for arithmetic, not proposed agency rates or measured industry performance.
| Hypothetical input or output | Value | Arithmetic | Interpretation |
|---|---|---|---|
| Acquisition horizon | 6 months | Chosen planning period | Not a sales-cycle promise |
| Total acquisition cost | S$15,000 | (2,000 + 500) × 6 | Excludes costs not supplied |
| Qualified leads | 60 | 10 × 6 | Assumed, not predicted |
| Expected wins | 12 | 60 × 20% | Modelled average, not guaranteed count |
| Modelled contribution | S$72,000 | 12 × 20,000 × 30% | Before acquisition cost |
| Scenario return | 380% | (72,000 − 15,000) ÷ 15,000 | Not measured incremental ROI |
The cost formula is (monthly programme cost + monthly additional costs) × acquisition months. Expected wins are qualified leads per month × acquisition months × win rate. Modelled contribution is expected wins × contract value × contribution margin.
Scenario return is (modelled contribution − total acquisition cost) ÷ total acquisition cost. Multiply by 100 to express it as a percentage. If total cost is zero, this ratio is undefined. A calculator should say so rather than present an infinite return as a persuasive result.
Why the attractive answer is not proof
The model assumes all sixty leads are relevant to this scenario. It does not demonstrate that search work produced them. It assumes the contracts can be delivered at the stated margin. It does not establish when the wins close or payments arrive. The arithmetic is correct only within those assumptions.
If those ten monthly qualified leads already existed before the programme, counting all of them as newly created business overstates incremental value. If half would have arrived through referrals anyway, attribution alone cannot resolve the counterfactual. The calculator cannot observe either fact.
Use the result to identify what needs validating. Where did the lead assumption come from? Is the win rate calculated from mature comparable opportunities? Does contract value reflect the relevant service? Can the company fulfil the work? Those questions are the business case, not an inconvenience after the percentage.
Calculate break-even before arguing about a forecast
In this example, contribution per expected win is S$6,000: S$20,000 multiplied by 30%. Total acquisition cost is S$15,000. The continuous-model break-even wins are therefore 2.5. Actual whole contracts would require three wins to exceed that cost under the same assumptions.
At a 20% win rate, the model needs 12.5 qualified leads across the period for expected contribution to equal acquisition cost. Over six months, that is about 2.08 qualified leads per month. This is an expected-value threshold, not a statement that thirteen real leads must yield a specific number of contracts.
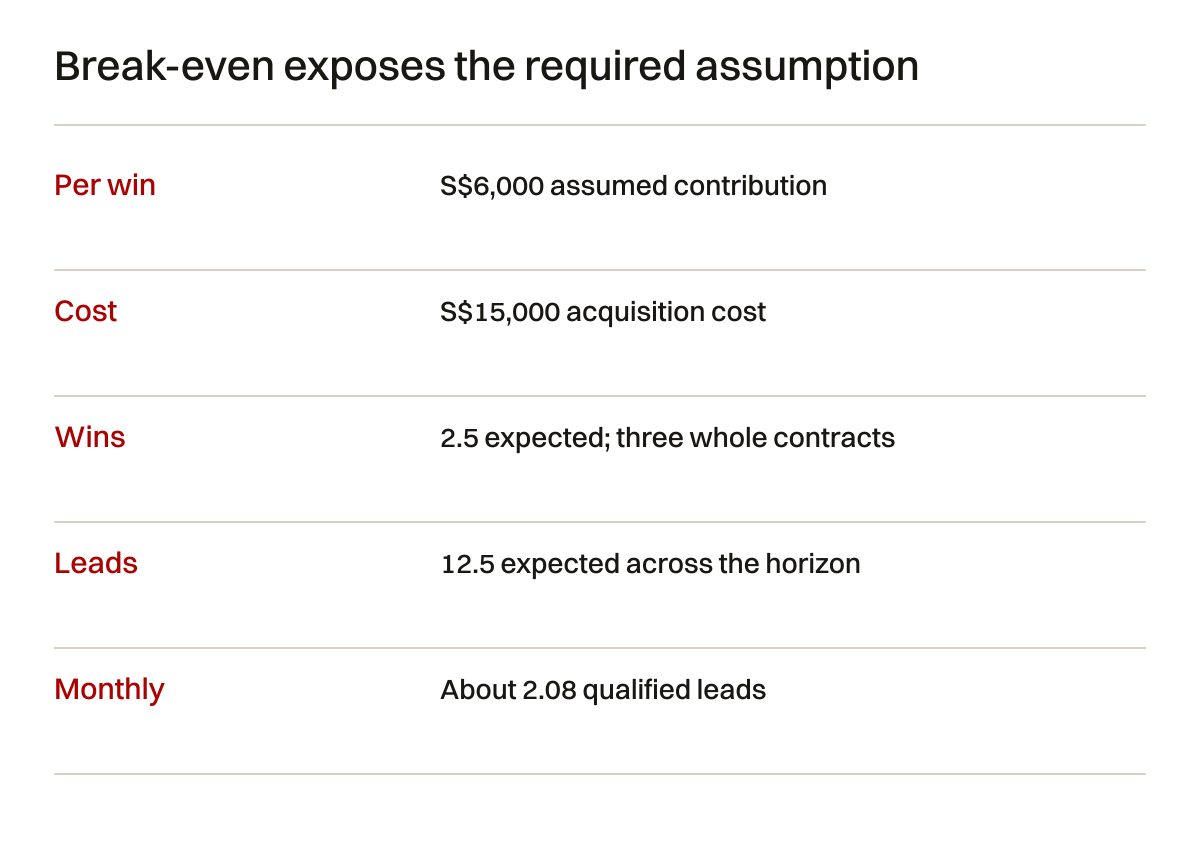
The formulas are break-even wins = total cost ÷ contribution per win and break-even qualified leads = total cost ÷ (win rate × contribution per win). A zero win rate or zero contribution per win means this model has no finite break-even lead count. A negative contribution requires addressing delivery economics first.
Expected values do not remove small-number risk
A 20% average win rate does not ensure exactly one win from every five enquiries. A small B2B company can experience long periods without a win and then close a large appointment. The scenario is a planning average, not a smooth monthly revenue schedule.
Do not borrow a win rate from every enquiry in the CRM. Use comparable qualified opportunities and state the sample size. If a new service has no mature records, provide a range and label it as judgement. More decimal places do not make uncertain inputs more reliable.
The break-even calculation is useful because it makes the required assumption visible. It can show that a programme needs only a small amount of suitable business, or that the delivery margin makes the target difficult. Neither conclusion requires pretending a forecast is a measured result.
Test the inputs that can change the decision
Sensitivity analysis asks how the result changes when an assumption changes. Start with the inputs you know least well and those with the largest plausible effect. Qualified-lead volume, win rate, contract value, margin and complete cost are obvious candidates.
In the next table, lead volume alone changes. All other values remain at the hypothetical baseline. The rows are not market forecasts. They are reproducible arithmetic showing why the lead assumption deserves investigation.
| Qualified leads each month | Six-month expected wins at 20% | Modelled contribution at S$6,000 per win | Scenario return on S$15,000 cost |
|---|---|---|---|
| 1 | 1.2 | S$7,200 | −52% |
| 2 | 2.4 | S$14,400 | −4% |
| 3 | 3.6 | S$21,600 | 44% |
| 5 | 6 | S$36,000 | 140% |
| 10 | 12 | S$72,000 | 380% |
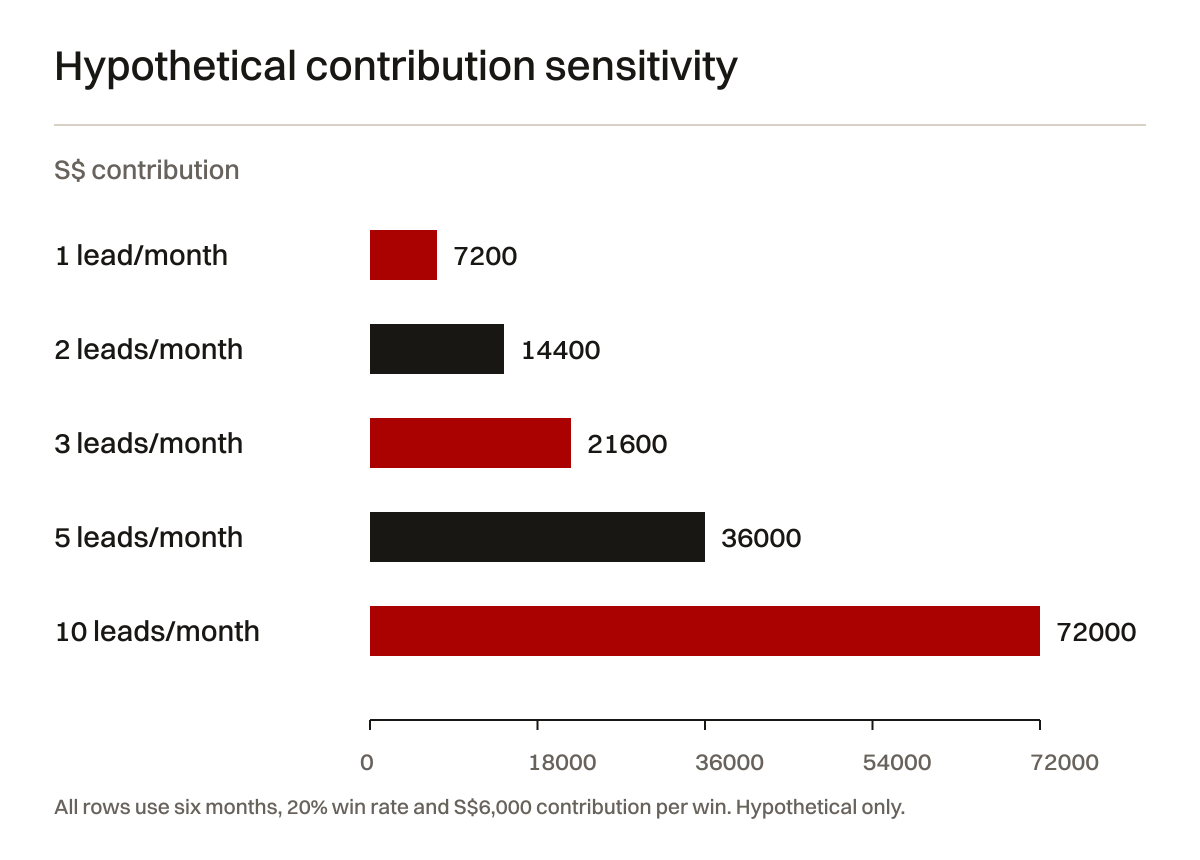
Keep the cost line visible when discussing these results. A chart of contribution alone can look favourable even when acquisition cost exceeds it. The workbook includes the cost, net scenario contribution and return for each row so the reader can inspect the full comparison.
Change more than one assumption carefully
The flat lead-rate assumption is another important sensitivity. A new programme might not produce the same suitable demand from its first month. Instead of assuming ten qualified leads in each of six months, a separate hypothetical ramp could use zero, one, two, three, four and five. That yields fifteen qualified leads, three expected wins at 20%, and S$18,000 modelled contribution at S$6,000 per win. Against S$15,000 acquisition cost, the scenario return is 20%.
This ramp is invented to demonstrate timing sensitivity, not a prediction of typical SEO development. Its lead total is one quarter of the flat baseline, so its contribution is also one quarter under unchanged assumptions. A founder should inspect the basis for the assumed timing, not select whichever curve produces the desired result. The browser calculator uses a constant monthly lead input. The workbook's Monthly ramp sheet records this separate example, but is a static register: changing inputs does not recalculate its outputs. Retain the formula basis and check any new calculation separately.
Some inputs move together. More low-intent leads can reduce win rate. Larger contracts can require more sales effort or have lower margins. Treating every favourable input as independent can produce an implausible best case.
Construct coherent scenarios instead. A cautious scenario could combine lower suitable lead volume with a longer sales cycle. A capacity-constrained scenario could include the additional delivery costs needed for growth. Explain why each combination is plausible and do not imply probabilities you have not estimated.
If a small change in one assumption reverses the decision, investigate that assumption before approving a large commitment. The useful output may be “we need better qualification records” rather than “buy more content.” That is a legitimate result of the analysis.
Follow lead cohorts until the comparison is fair
A lead cohort groups enquiries received in the same period or under the same programme conditions. Follow each cohort through qualification, proposal, win, loss and delivery. This preserves the time relationship between acquisition cost and eventual commercial outcome.
Recent leads may still be open. Comparing their win rate with a year-old cohort is unfair unless you account for maturity. For a construction appointment with a long procurement process, a six-month acquisition period may need a longer outcome observation period.
Acquisition horizon is not payment horizon
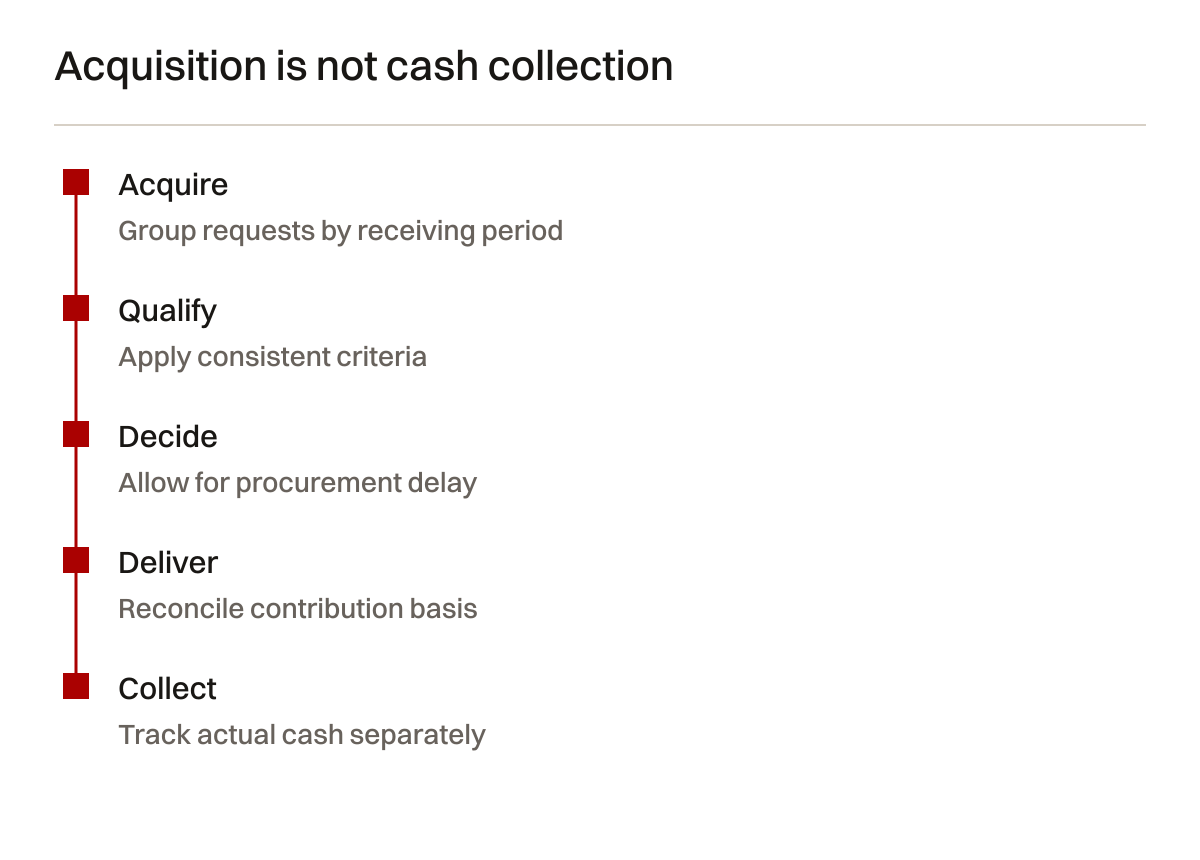
The simple model uses six acquisition months but no explicit cash timing. A founder must build a separate cash-flow view. Costs may be paid monthly while contracts close and invoices settle much later. A positive eventual contribution does not guarantee the business can fund the wait.
Record proposal dates, decision dates, contract value, expected delivery costs and payment milestones. Keep open pipeline distinct from won work and cash received. If a report adds all three together, it cannot support a responsible spending decision.
For a marine supplier, repeat purchases may happen sooner than a major construction tender. For an engineering consultancy, approval can depend on a project starting. Use the relevant cohort and buying cycle rather than one standard window for every service.
Correct the record rather than defend the forecast
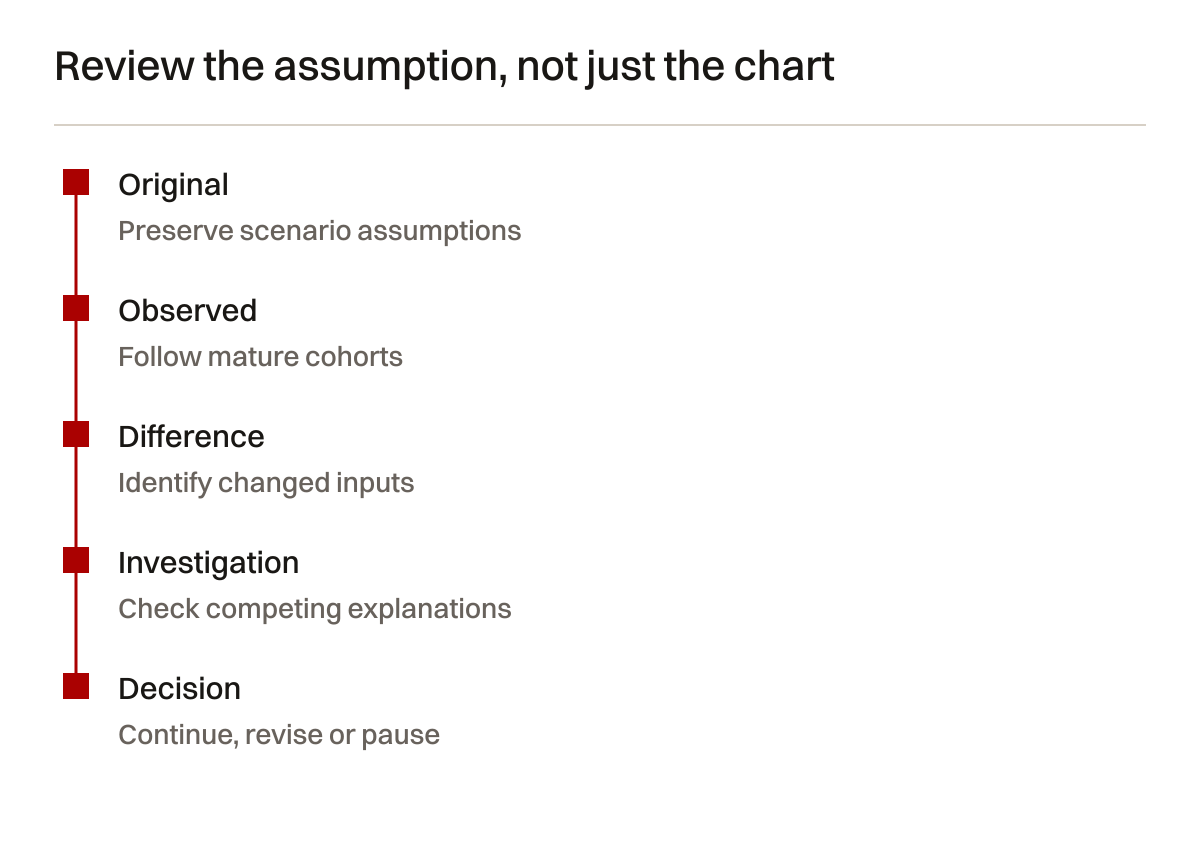
When actual data arrives, compare it with the assumptions. Did fewer qualified leads arrive? Did the service mix change? Were proposals delayed? Did margin decline? Record the differences and revise the planning case. The original spreadsheet is not a promise that must be defended.
Retain the original assumptions so the team can learn. Quietly editing last month's forecast to match today's result removes that learning. A versioned record helps explain whether the decision was reasonable given the evidence available at the time.
Build a commercial record before claiming ROI
At minimum, retain a privacy-conscious enquiry identifier, date, relevant service, qualification state, source information where available, commercial outcome and financial basis. Restrict access appropriately. The purpose is a trustworthy business record, not unrestricted tracking of every person.
Confirm the website event represents what its label says. Google's key-event documentation explains an analytics designation. It does not verify that your event means a received, suitable enquiry. That needs inspection of the actual implementation and receiving process.
The Events report documentation describes event reporting. Use it as the tool reference while documenting the business definition separately. A repeated event, spam submission or test request should not silently become another qualified opportunity.
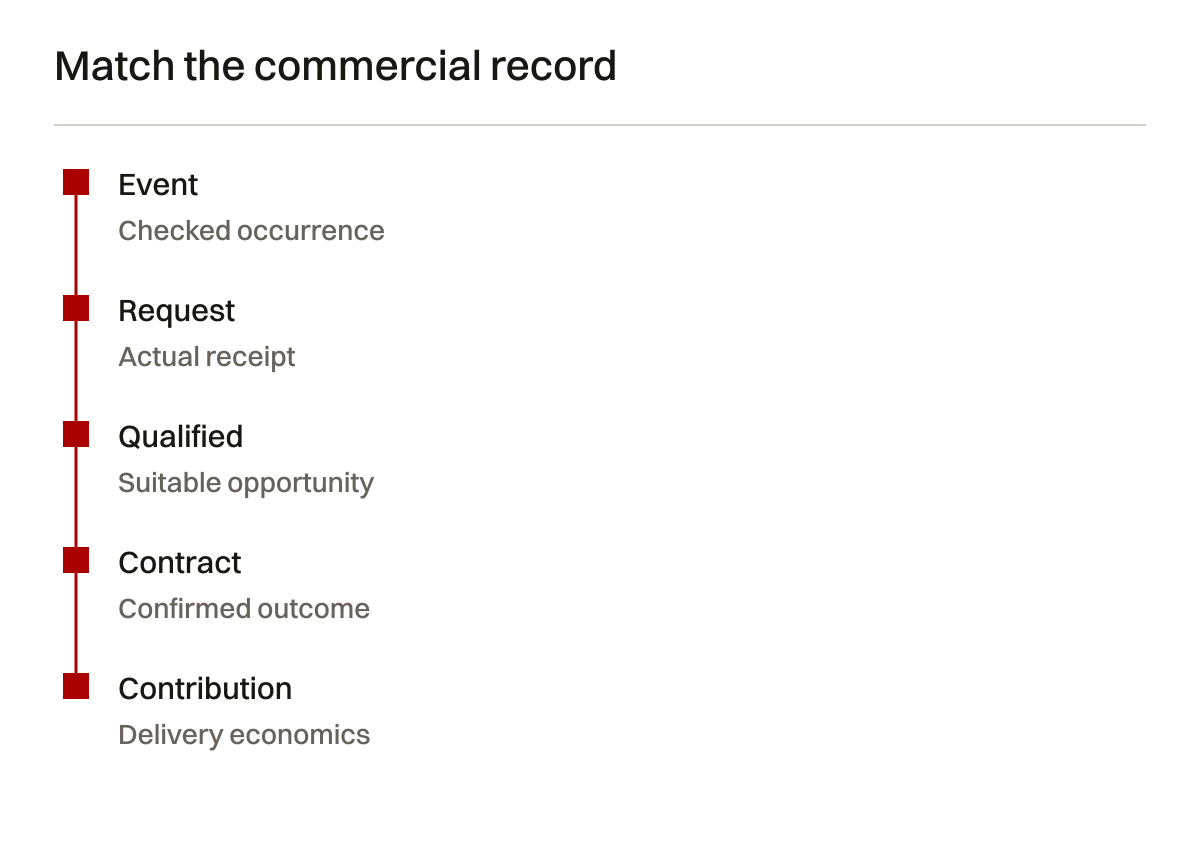
| Record | Required distinction | Verification question | Common overstatement |
|---|---|---|---|
| Website event | Trigger versus actual receipt | Did the receiving team get it? | Every click is a lead |
| Received enquiry | Suitable versus unsuitable request | Does it match the service and scope? | Every contact is qualified |
| Opportunity | Open versus closed decision | Has procurement actually decided? | Pipeline is revenue |
| Won contract | Value versus realised contribution | What costs and changes apply? | Contract value is profit |
| Source record | Attribution versus causality | What does the evidence support? | Organic created the whole sale |
Account for data limitations
Consent choices, missing tags, browser behaviour and offline conversations can leave gaps. Google's data quality guidance, threshold documentation and sampling documentation are relevant references when inspecting an analytics report's limitations.
Do not infer that every gap has been corrected by modelling. Record the available basis and the remaining uncertainty. A CRM source entered by a salesperson has different strengths and limitations from a website referral record. Neither should overwrite the other without explanation.
Choose the acquisition report appropriate to the question. Google's user and traffic acquisition comparison distinguishes these report scopes. A founder does not need to memorise every dimension, but the analyst must state which one was used and why.
Retention decisions also affect later inspection. Use the data retention reference when deciding which authorised records will remain available. Retain only what is appropriate for the business purpose and applicable obligations, not everything merely because the tool permits it.
Incremental ROI needs a credible comparison
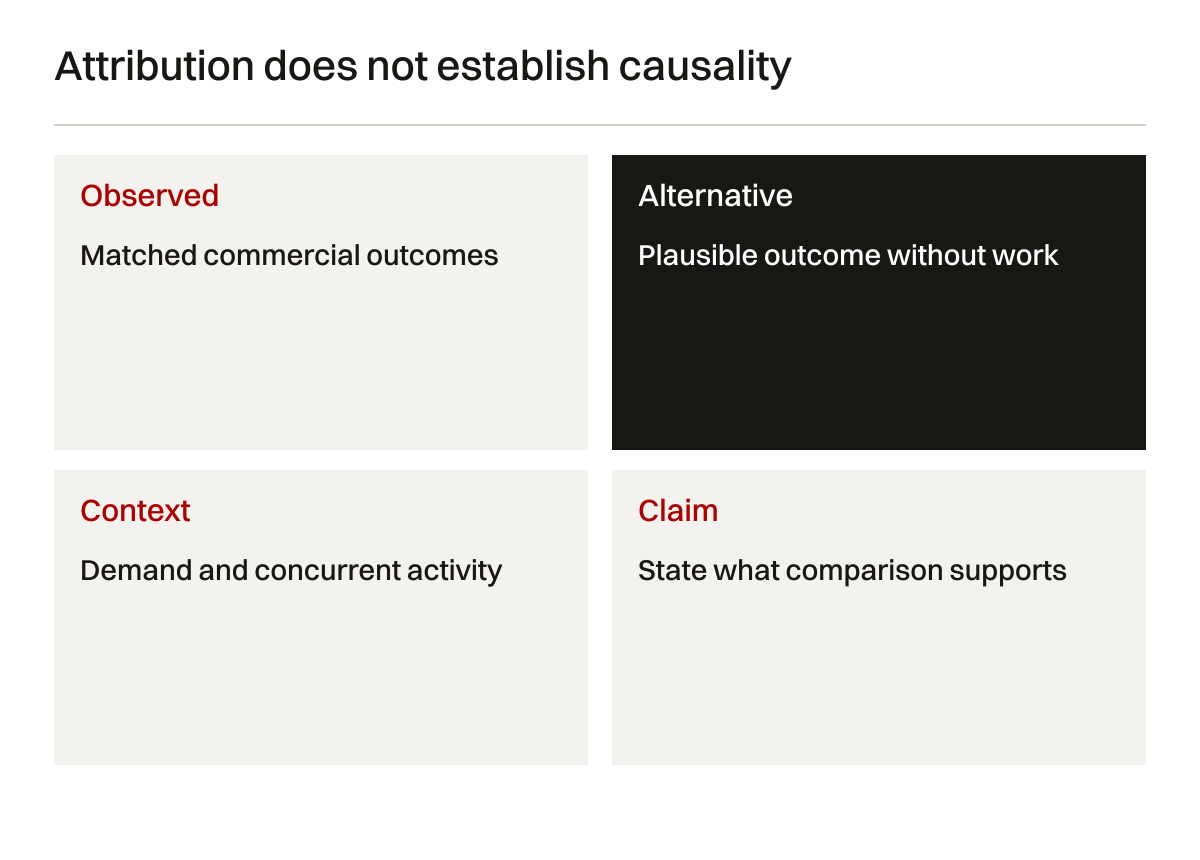
Incremental contribution asks how much additional contribution the work caused relative to a plausible alternative without it. Incremental ROI then compares that estimate with the costs attributed to the intervention. This is a more demanding claim than matching orders to organic visits.
A before-and-after comparison can be useful but has threats. Demand, seasonality, sales activity, prices, service availability and other campaigns may change. A rise after publication is not enough to isolate publication's effect. Record concurrent changes and plausible alternative explanations.
Possible approaches and their limits
A phased rollout across comparable page groups can provide a more informative comparison than changing everything at once. Yet page groups may differ in demand or buyer intent. A control period can help contextualise changes but is not automatically comparable. An experiment needs design before the outcome is known.
For a small B2B company with a few large contracts, precise causal estimation may not be practical. Say so. Use triangulated evidence: relevant discovery, suitable enquiries, commercial records and documented changes. This can support a decision without pretending it proves a single exact incremental return.
The fallback is not invented certainty. Present attributed contribution and a separate uncertainty assessment. You can still decide whether to continue work based on its cost, the plausibility of benefit, observed progress and the remaining risk. Business decisions often use imperfect evidence; good analysis makes its limits visible.
AI can calculate a model without validating it
An AI tool can assist with arithmetic checks, spreadsheet explanations and scenario generation. It can also generate a convincing ROI paragraph from incomplete inputs. The critical task is reviewing the definitions, records and assumptions before asking it to interpret the result.
Check formula units. Monthly leads multiplied by months should produce a cohort count. A percentage must use the correct decimal representation. Contract value and contribution margin must refer to the same service boundary. These are ordinary errors that can survive polished prose.
Require the analyst to reproduce one scenario manually. If they cannot explain why a positive result is not measured incremental ROI, the report is not ready. The objection is not to AI assistance. It is to outsourcing responsibility for the business claim.
Do not hide a weak case behind an impressive percentage
A 380% scenario return looks persuasive. It is still built from hypothetical inputs. Put that label beside the chart, not only in a footnote. Do not place it next to a testimonial or client logo where readers may infer an actual result.
If the business has only a small number of opportunities, show counts as well as rates. “Two wins from ten mature qualified opportunities” is more interpretable than a bare 20% win rate. The record should also explain how qualification was applied and whether the opportunities are comparable.
What to ask your provider at the next review
Create a decision record, not just a report archive
A monthly report should end with a decision that the next report can inspect. Perhaps the team will repair qualification, improve one service page or continue observing a recent cohort. Name the expected evidence and the review date. Otherwise the same reassuring narrative can repeat while nobody learns whether the original assumption was reasonable.
Keep the decision separate from the activity list. Publishing four articles is a completed task. Testing whether those articles answer questions from suitable buyers is a review. Identifying that they attract unrelated readers is a finding. Choosing to stop that topic group is a decision. All four can appear in one record, but they should not be treated as interchangeable achievements.
| Review situation | What to inspect first | Decision the evidence may support | Claim to avoid |
|---|---|---|---|
| Visits rise, qualified enquiries do not | Query mix, page purpose and receiving records | Investigate suitability and conversion tasks | Traffic guarantees future revenue |
| Enquiries rise, wins remain open | Cohort maturity and procurement timing | Extend observation without counting pipeline as cash | All open opportunities will close |
| Wins rise, contribution falls | Service mix and actual delivery costs | Reassess economics and qualification | Revenue growth proves profitability |
| Attributed contribution rises during another campaign | Branded demand and concurrent activity | Separate source credit from causal interpretation | SEO caused all observed improvement |
| Records contain duplicate or test requests | Identifier matching and event behaviour | Repair measurement before recalculation | More recorded events mean more buyers |
These are original review examples. They are not findings from Creatif Work clients. Their value is in making the next investigation explicit. A real business should choose the relevant row only after inspecting its own records.
Compare alternatives without pretending they are identical
A founder may compare continued SEO work with paid search, referral development or direct sales support. Use the same commercial definitions where possible. Compare qualified opportunities rather than raw clicks. Count the appropriate acquisition costs. Use comparable maturity windows and state where the services serve different purposes.
Organic search can support information that buyers use after a referral or sales conversation. Paid search can test a demand hypothesis quickly but has different spend and observation conditions. Direct sales can generate relationships that later produce branded searches. These interactions make simple channel rankings misleading. An analysis should identify them rather than award every contract to the last visible touchpoint.
Do not count the same contribution fully against several programmes when presenting a combined business case. If multiple teams influenced one contract, retain that fact and explain the allocation convention. A company-wide contribution record must reconcile to actual business totals. Several dashboards claiming the same full revenue do not create additional revenue.
Consider reversibility as part of the spending decision. A limited diagnostic or a focused repair may reduce uncertainty before a larger programme. A rushed long-term commitment based on hypothetical returns does not become safer because the calculator has attractive colours. The purpose of the model is to reveal assumptions that deserve scrutiny.
Plan for an unfavourable result
Agree a review condition before spending. It might be missing qualified demand, unworkable approval capacity or a measurement gap that cannot yet be resolved. Do not use an arbitrary ranking deadline when the actual business question concerns suitability and contribution. Equally, do not allow every disappointing outcome to be excused indefinitely as a long-term investment.
If the case weakens, document why and what can be changed. Some problems need different content; others require service clarity or a receiving-process repair. Some programmes should pause. A provider who can explain a sensible stopping condition gives the founder a more useful basis for trust than one who treats continued spending as the only acceptable answer.
Ask them to separate activity, search observations, qualified enquiries and financial outcomes. Ask for the cost boundary and the sales maturity window. Ask which result is attributed, which is modelled and which is supported by a credible causal comparison.
Then ask what would change their recommendation. If suitable discovery improves but enquiries remain poor, perhaps page scope or receiving process needs attention. If traffic grows through unrelated topics, publishing more of the same may be wrong. If delivery margin is too low, search work cannot repair that financial constraint.
Keep the meeting focused on decisions. A disappointing result should produce an investigation or an adjustment, not another generic assurance that SEO takes time. A promising result should still have its limitations stated. Neither patience nor optimism replaces the records needed to learn.
Method and limitations
The formulas, charts and downloadable rows in this article are original teaching models. The sensitivity dataset can be reproduced from the stated inputs. No client outcomes, representative conversion benchmark or agency pricing claim is supplied. Sources were reviewed on 3 October 2026.
The model does not establish demand, causality, cash timing or delivery capacity. Financial and measurement definitions should be agreed with the responsible people in your business. Where a provider makes a stronger claim, request the design and evidence that support it.
Start with the problem
If your SEO report turns traffic into revenue without explaining the calculation, the next step is not a bigger forecast. It is a better measurement question. Bring the report and the commercial concern to Creatif Work so we can discuss what can be verified and what still needs investigation.
Our SEO service connects search work with page purpose, useful evidence and continued review. For the audit structure behind that discussion, see what a useful SEO audit should tell you. We do not need to promise a return percentage to identify a defensible next decision.
Test the assumptions yourself.
An illustrative contribution model, not measured SEO ROI. These starting numbers are invented teaching assumptions, not our prices or client results.
Modelled results
- Total acquisition cost
- $15,000
- Assumed eventual wins
- 12
- Modelled eventual contribution
- $72,000
- Scenario return after acquisition cost
- 380%
- Break-even qualified leads per month
- 2.08
Cost = monthly costs × acquisition months. Eventual contribution = monthly qualified leads × acquisition months × win rate × contract value × contribution margin. This assumes steady lead volume and fully matured sales outcomes. Wins can happen later than the acquisition horizon. Fractional wins are an expectation, not a partial contract. The model excludes unentered costs, discounts, cash timing and tax. It does not prove SEO caused the wins.
Calculations run in this page. The calculator does not submit or store your inputs. Reloading restores the example.